Titan Images 2012

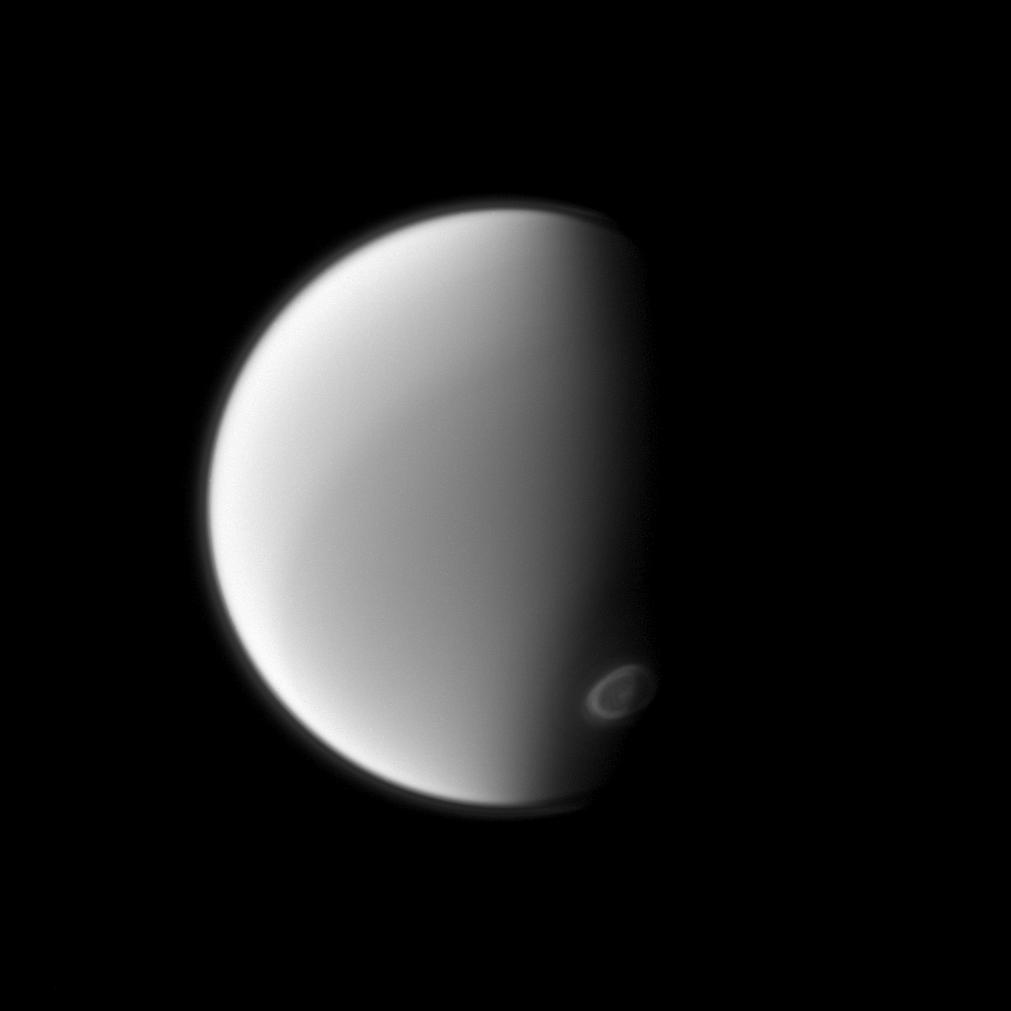
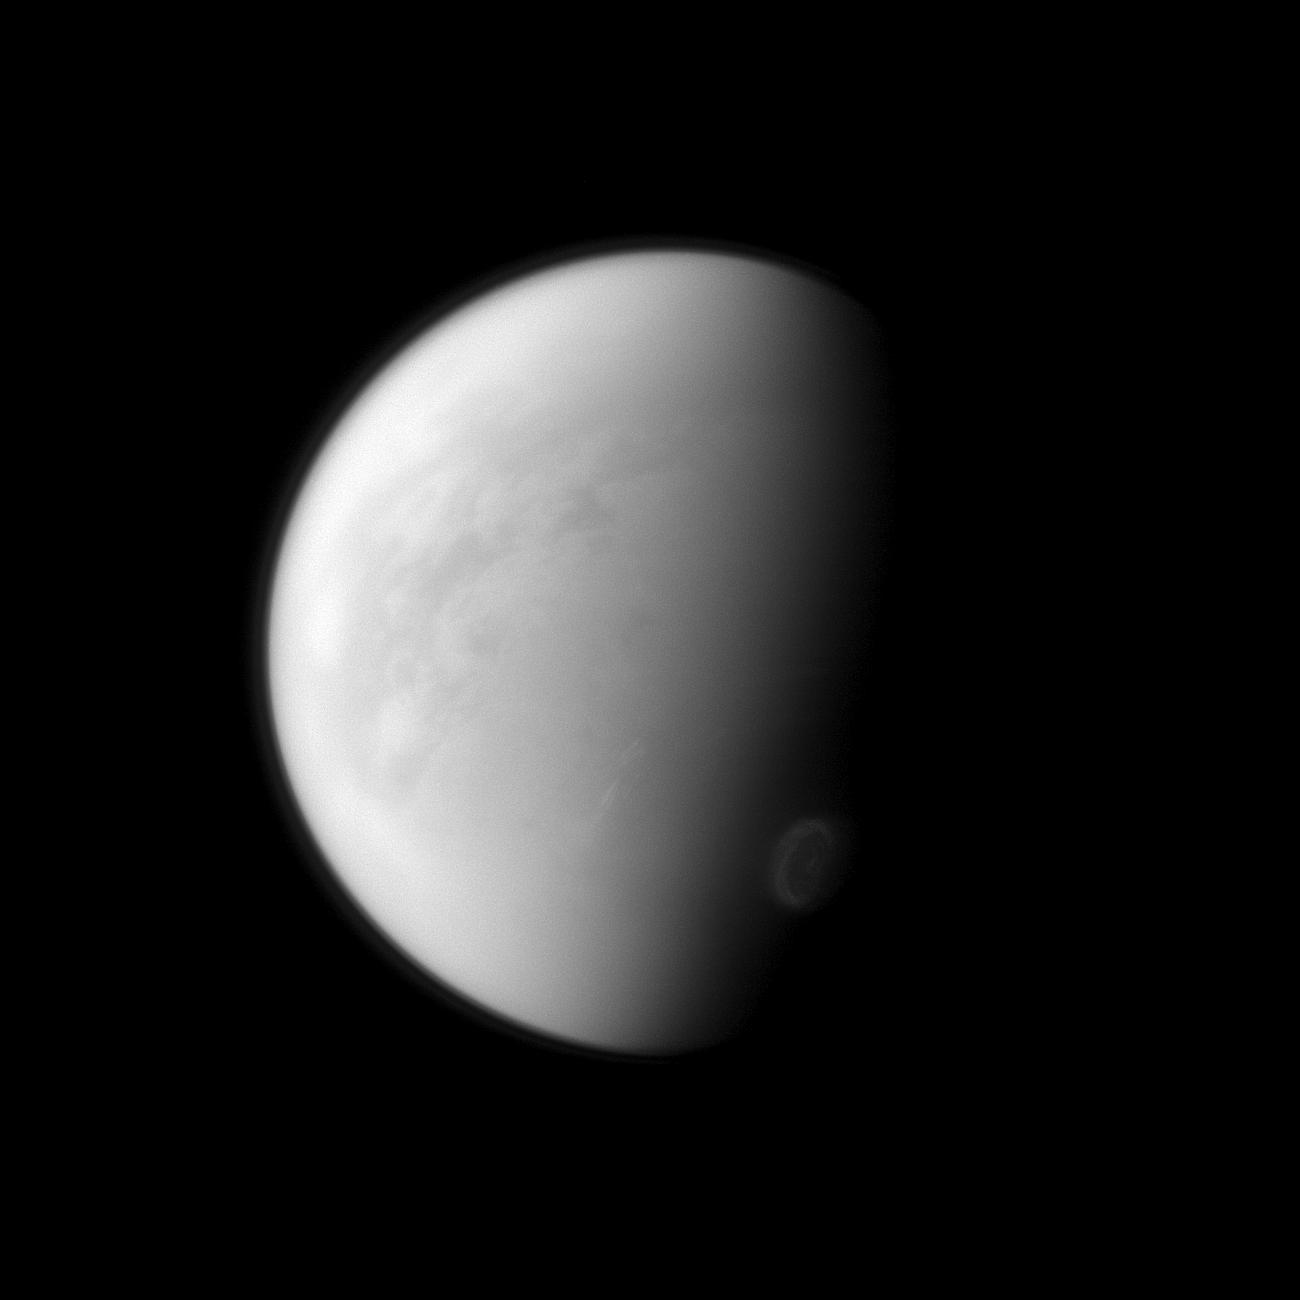
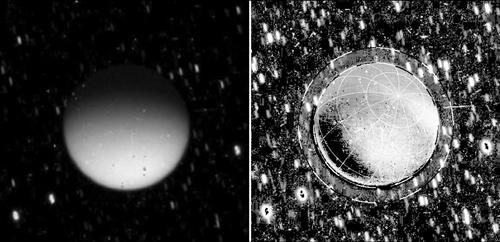
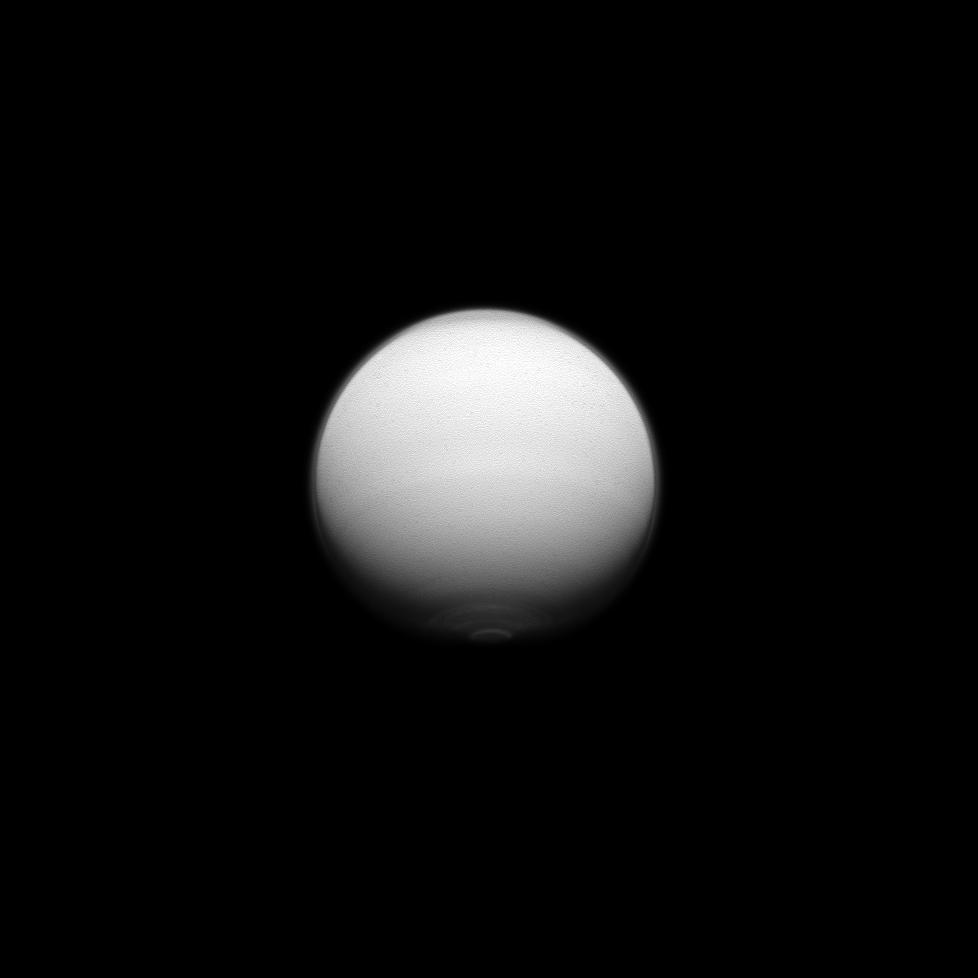
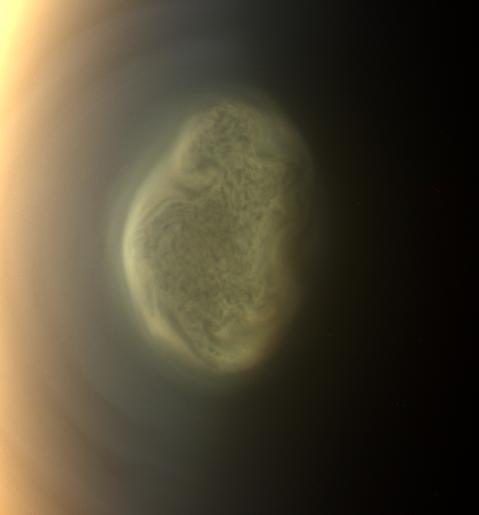
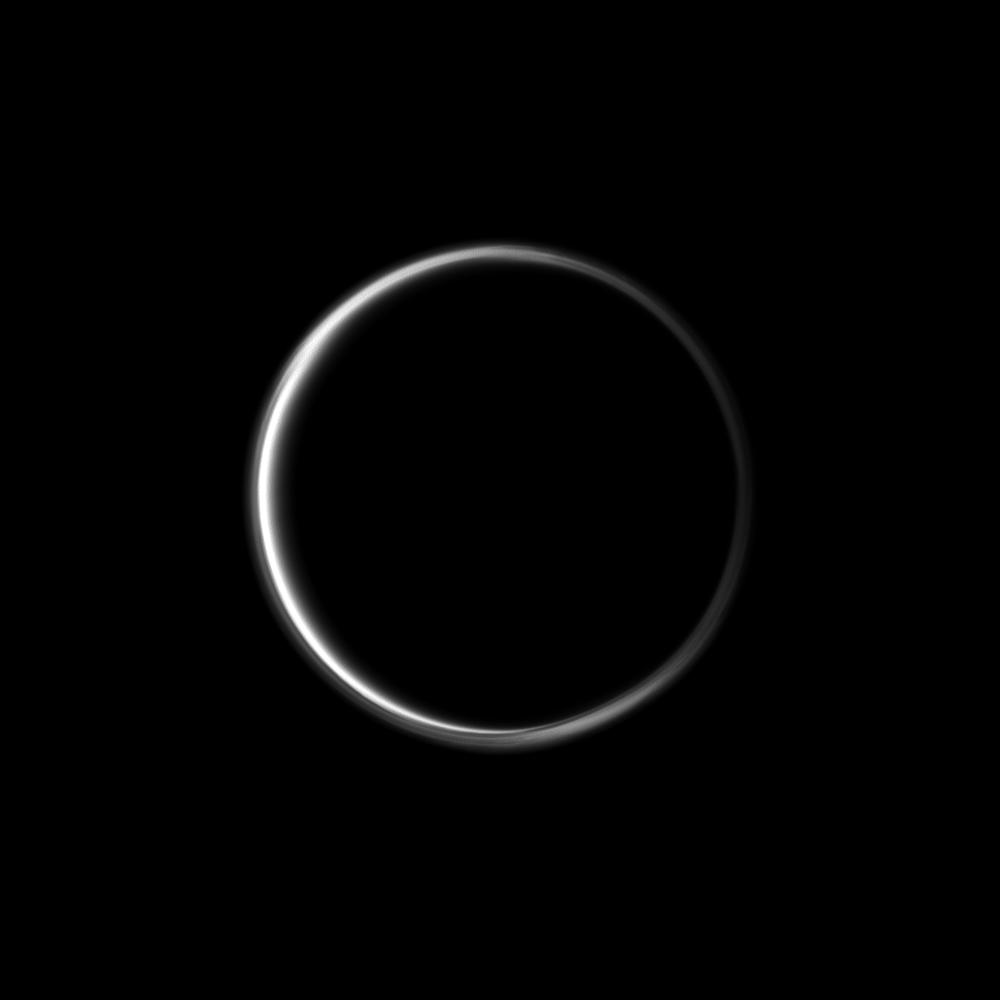
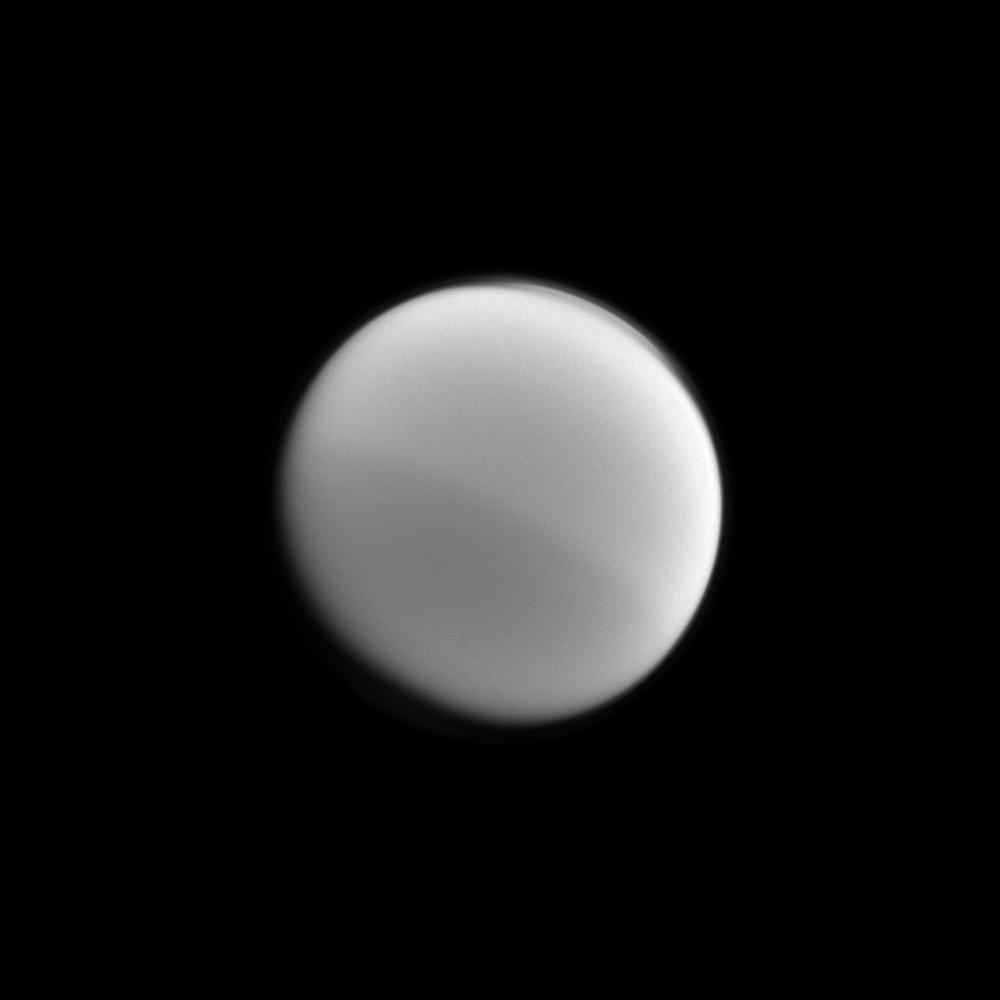
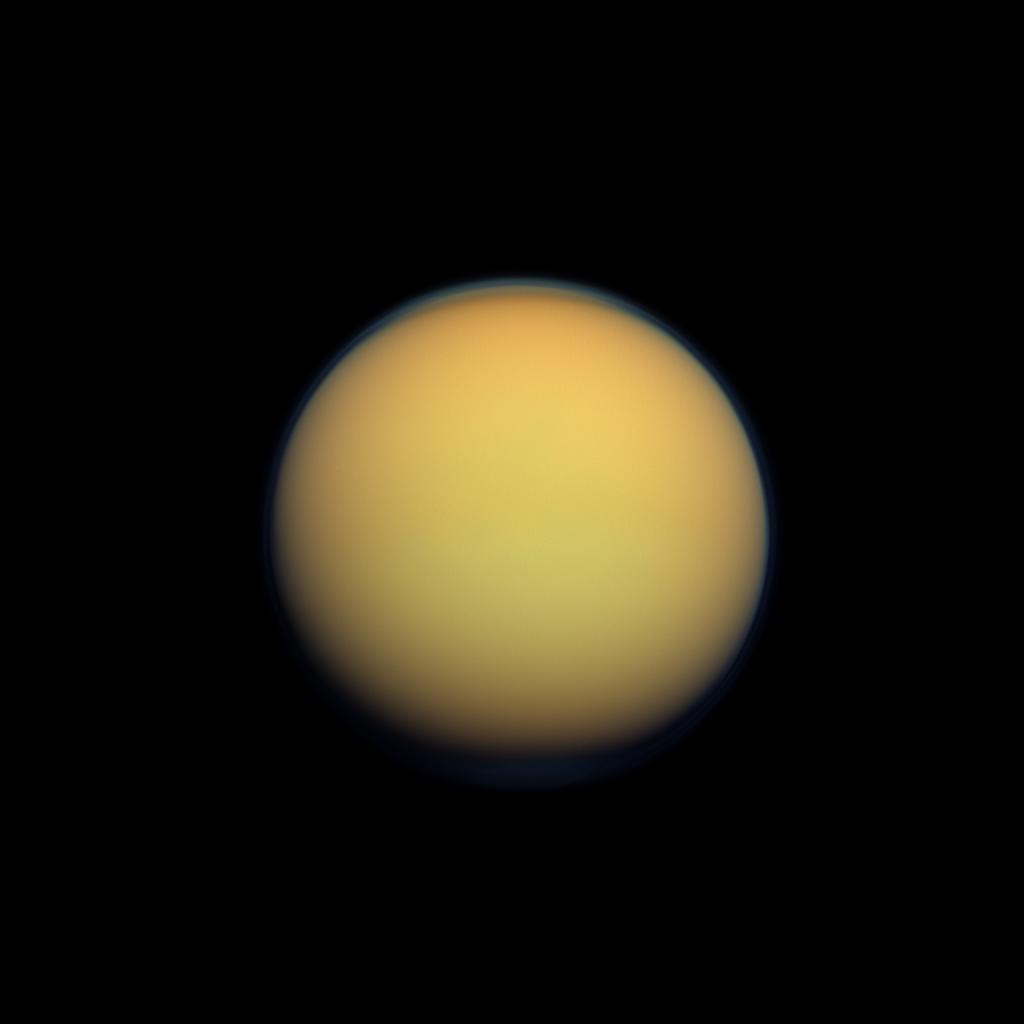
The near-infrared image of Titan's disc above clearly shows the south polar vortex which had already been clearly identified on June 26, 2012. This swirling mass of gas may be closely related to seasonal factors and a parallel could be drawn with the giant north polar ethane cloud system which had been observed a few years ago during the Winter period in the northern hemisphere. One may assume that this atmospheric vortex will continue developing at least until the end of the next Winter period in the southern hemisphere.
The image was obtained with the Narrow-Angle Camera of the Cassini probe on September 13, 2012 using a spectral filter sensitive to wavelengths of near-infrared radiation centered at 889 nanometers. North on Saturn's largest moon is up and inclined 36 degrees to the left and the south polar area is clearly visible in the field of view. The Camera is orientated toward the anti-Saturn hemisphere of the Opaque Moon. The view was taken at a distance of about 1 million miles or 1.6 million kilometers from the Orange Moon and at a Sun-Titan-spacecraft, or phase, angle of 73 degrees.

Image Credit: NASA/JPL-Caltech/Space Science Institute.   


This map of the Opaque Moon Titan shows the locations of mountains that have been named by the International Astronomical Union. The names of mountains are derived, by convention, from the names of mountains in the fictional universe setting known as Middle-earth appearing in the fantasy novels "The Hobbit" and "The Lord of the Rings" written by John Ronald Reuel Tolkien.
One can clearly notice a relatively high concentration of mountains at low latitudes close to the Huygens Landing Site specified in this map which incorporates data obtained by both the Visual and Infrared Mapping Spectrometer (VIMS) and the Radar Mapper of the Cassini probe.

Image Credit: NASA/JPL-Caltech/University of Arizona/USGS.


The radar view in the upper part of the table unveils a well defined river system on Titan that is reminiscent of the well known Nile River. The image was taken with the Radar Mapper of the Cassini probe on September 26, 2012 during the 87th close flyby of Saturn's largest moon. The river system on Titan, which is observed with a relatively high resolution appears particularly vast. The river valley stretches more than 200 miles or 400 kilometers and runs into Ligeia Mare, the second largest body of liquids in the high latitudes of the northern hemisphere of the Orange Moon. North appears toward the top of the view.
The dark and uniform appearance of the presumed rivers or seas allows scientists to infer that they are relatively flat or smooth with a low reflectivity and that they are filled with liquids. The assumed liquid may be composed of a mixture of ethane and methane. Let's note that ethane was positively identified by the Visual and Infrared Mapping Spectrometer in the lake known as Ontario Lacus in the high latitudes of the southern hemisphere in 2008.
The river is not particularly sinuous and is relatively straight even if a few branches or deflections can be observed. The river valley may follow the trace of at least one fault. Such faults may engender the opening of basins or even the formation of giant seas such as Kraken Mare, the largest body of liquids identified in the northern hemisphere.
The mosaic in the lower part of the table unveils a portion of the Nile River, near the Fourth Cataract in Sudan, in black and white. The two images of the mosaic are gray-scale images obtained from NASA's Space Shuttle. The upper view of the mosaic was originally captured with color infrared film from the Space Shuttle Columbia in November 1995. The radar view appearing in the lower part of the mosaic was taken by Spaceborne Imaging Radar C/X-Band Synthetic Aperture Radar (SIR-C/X-SAR) aboard Space Shuttle Endeavour in April 1994.
One can clearly notice the current channel of the Nile and an older channel buried in drifting sands. The Nile River appears to be the longest river on Earth with a length of more than 3,700 miles or 6,000 kilometers). The Nile runs through 10 countries and is connected to the Mediterranean Sea. A few portions of the Nile such as the segments observed in the Radar view are generated by faults. That's why nearly right-angle changes in the course of the river can be observed in these images.

Image Credit Upper View: NASA/JPL-Caltech/ASI.
Image Credit Lower View: NASA/JPL-Caltech.


This near-infrared view of Titan's disk reveals some landscape features, the upper limits of the atmosphere, a cirrus-like cloud in the lower part of Saturn's largest moon and a recently discovered south-polar vortex. The vortex is a swirling mass of gas, apparently related to seasonal factors, which is rapidly rotating. The southern hemisphere of the Opaque Moon is currently experiencing the Autumn season. The vortex may continue to grow as the Winter season is approaching in the area. In natural color views, the vortex tends to appear yellowish.
The image was obtained with the ISS Narrow-Angle Camera of the Cassini probe on August 31, 2012 using a spectral filter sensitive to wavelengths of near-infrared radiation centered at 938 nanometers. The view was taken at a distance of about 750,000 miles or 1.2 million kilometers from the Orange Moon and at a Sun-Titan-probe, or phase, angle of 74 degrees. The camera is orientated toward the trailing hemisphere of Titan. North on Saturn's largest moon is up and rotated 9 degrees to the left.

Image Credit: NASA/JPL-Caltech/Space Science Institute. 


This set of images shows Saturn's largest moon Titan glowing in the dark in a configuration in which Saturn is eclipsing Titan from the Sun. As a result, these images of the orange disc demonstrate that the Opaque Moon generates its own light in the absence of light coming from the Sun. The left view corresponds to a calibrated, but unprocessed image from the imaging camera of the Cassini probe. The right view was processed to remove reflected light off Saturn. One can clearly notice that the moon is emitting its own light.
The outer dashed line in the right view, delimitating an atmospheric area of about 625 miles or 1000 kilometers in altitude shows the light emanating from a high altitude in the atmosphere. Surprisingly, most of the light is diffusing up from lower down in the haze, from approximately 190 miles or 300 kilometers above the ground.
The photo was obtained on May 7, 2009. The camera kept focused on the Opaque Moon during a 560-second-long exposure time to get this outcome. That's why the stars in the background appear as bright streaks. Their relative position to Titan moved during the long exposure of the snapshot generating the bright streaks observed in the images.

Image Credit: NASA/JPL-Caltech/Space Science Institute. 


The set of radar images above unveils portions of the high latitudes of the northern hemisphere of Saturn's largest moon. The views reveal stable northern Lake District. The upper view reveals a portion of the radar swath acquired with the Radar Mapper of the Cassini probe on May 22, 2012. The radar swath is centered near 79 degrees north latitude, 58 degrees west longitude and is approximately 220 by 47 miles or 350 by 75 kilometers in dimension. The radar swath shows some previously unseen areas but also some regions hosting lakes that were last observed about six years ago or almost one Titan season ago. Thus, it appears relatively interesting to compare the evolution of lakes that had already been observed six years ago.
The images in the lower part of the mosaic enable us to perform comparisons of the evolution of particular lakes observed in this radar swath and in the radar view taken in 2006. Let's note that the radar views appear slightly different from previous radar images because they use a new filtering technique. The illumination is coming from the bottom of the radar view. The left radar portion in the lower part of the mosaic shows one of the lakes obtained with the Radar Mapper of the Cassini probe in September of 2006. The second radar view from the left shows the same lake taken with the Radar Mapper in May 2012. The third and the fourth image from the lower left shows another set of lakes taken with the Radar Mapper in October 2006 and May 2012. The radar views of May 2012 don't show any clear sign of change in lake levels since the images of the 2006 flyby. Let's note that the north polar lakes were experiencing the darkness of the Winter season in 2006. The Spring season of the northern hemisphere started in August 2009. The observations of the lakes in May 2012 were obtained during the Spring season. Numerous scientists had anticipated a progressive decrease in the level of the north polar lakes as the Summer season approaches and with the rise of the Sun.
The relative stability in the level of the lakes is consistent with climate models that predict stability over several years. Yet, some scientists had predicted a partial or a full evaporation of most lakes in the north polar region due to the rise in temperatures related to the approach of the "Warm Season". The relative stability in the level of those lakes marks a contrast with the temporary darkening of some regions in the tropical or equatorial area after a rainstorm which took shape in 2010. The instruments of the Cassini probe will continue to monitor the evolution of landscape features in the high latitudes of the northern hemisphere up to the beginning of Summer in 2017. The evaporation level in the area may be higher than the precipitation level in the next Summer season of the northern hemisphere resulting in a fall of the lake levels. The past radar analyses showing a surprising stability of lake levels suggest however that net evaporation in the area during the next Summer period may be weaker than expected.

Image Credit: NASA/JPL-Caltech/ASI.


The images above correspond to radar views of the area of the famous lake known as Ontario Lacus in the south polar region of Saturn's largest moon Titan. The image was assembled on the basis of several radar swaths obtained with the radar instrument of the Cassini probe on July 2009 and January 2010. The lower view incorporates a red outline to show the limits of a presumed ancient sea in the area. The dark kidney-shaped area corresponds to Ontario lacus, a lake which is likely mostly composed of liquid ethane and methane. The upper view clearly shows that Ontario Lacus is surrounded by a large basin with a relatively dark appearance. The low reflectivity and the relative uniformity of this area may indicate that the area is relatively wet or damp or that it may have been eroded or shaped by the presence of an ancient sea.
The observation of the radar marking of the dark basin leads scientists to estimate that the assumed ancient sea was possibly as large as 300 by 170 miles across or 475 by 280 kilometers across and probably less than a few hundred feet or meters deep. Ontario Lacus which may be the remnant of this ancient sea is approximately 80 by 235 kilometers across, and probably at least 30 feet or 10 meters deep at its center. A parallel could be drawn between the Aral Sea and Ontario Lacus but the origin of the partial evaporation of the original sea is likely very different. The radical changes in the level of lakes and seas may be due to climate cycles and some scientists claim that seas may have covered significant parts of the southern hemisphere less than 50,000 years ago.
The bodies of liquids appear to be mostly concentrated in the polar regions of the moon. Three seas and over one hundred lakes have already been identified in the high latitudes of the northern hemisphere. Ontario Lacus is the largest body of liquids identified in the southern hemisphere where only a few lakes have been clearly identified. The dampest area appears to be the north polar region. Scientists advance that the level of the lakes or seas may be higher during the Winter season because colder temperatures favor condensation phenomena of methane or ethane and the development of cloud systems.
The dynamics of Titan's climate and meteorology may follow long term cycles similar to Croll-Milankovich cycles on our planet. There may be a cyclic transfer of liquid hydrocarbons from pole to pole related to changes in the orbital and physical parameters (changes in the inclination of the rotation axis, changes in the distance from the Sun for a particular season...). Currently, the liquids are mostly concentrated in the high latitudes of the northern hemisphere but less than 50,000 years ago, the cycle would have been reversed and regions of the southern hemisphere such as Mezzoramia and the area of Ontario Lacus may have contained most of the liquid hydrocarbons present on the surface of the moon.

Image Credit: NASA/JPL-Caltech/ASI/Proxemy Research.


The mosaic above shows, in its left part, a radar portion of the topography on Titan and, in its right part, a radar portion of the topography on Venus. The two landscape images unveil similar topographic features which may be related to an internal activity or volcanism. One can notice, on the Orange Moon, a network of linear features shaped like a hot cross bun. This overall shape shows a striking resemblance to the network of linear features in the image of Venus in the right part of the mosaic.
The Synthetic Aperture radar view of the Opaque Moon Titan was taken by the radar instrument of the Cassini probe on May 22, 2012. The bun lies at approximately 38.5 degrees north latitude and 203 degrees west longitude. The view was extracted from a longer radar swath, which is about 3,200 miles or 5,200 kilometers long and approximately 400 miles or 600 kilometers at its widest. The right view corresponds to a Synthetic Aperture Radar image of Venus acquired from the Magellan spacecraft of NASA.
The circular feature of Titan's landscape is approximately 43 miles or 70 kilometers in diameter with near-perpendicular markings about 37 miles or 60 kilometers wide, intersecting at its center. The illumination for this radar image comes from the right. In the radar view of Venus, the bright circular-shaped area of 20 miles or 30 kilometers across is located at the summit of a large volcano called Kunapipi Mons. This volcano lies at approximately 33.3 degrees south latitude and 85.5 degrees west longitude.
Scientists suggest that the topographic cross in the radar image of Titan corresponds to a network of fractures engendered by uplift from below. An internal activity or a volcanic activity may account for those topographic features. The pressure from cryomagma may have uplifted the surface, leading to the crossed cracks. Multiple planets or moons unveil that kind of topographic features.

Image Credit: NASA/JPL-Caltech/ASI.


The image above shows the disc of Titan with particular atmospheric features such as the south polar vortex which took shape recently, the dark north polar hood and the upper haze layer of the orange, deep and opaque atmosphere. The north polar hood, representing a relatively dark cap in the atmosphere, is visible at the top of the bright disc.  The south polar vortex, which has a yellowish appearance in natural color views, can be found in the atmosphere at the bottom of the bright disc.
The camera is orientated toward the anti-Saturn hemisphere of the Opaque Moon. North is toward the top of the disc. The image was obtained in violet light with the Wide-Angle Camera of the Cassini probe on July 25, 2012. The view was captured at a distance of about 175,000 miles or 281,000 kilometers from the Orange Moon and at a Sun-Titan-probe, or phase, angle of 37 degrees.

Image Credit: NASA/JPL-Caltech/Space Science Institute.


The view of Titan's disc above unveils the bright south polar vortex which seems to float in the upper part of the atmosphere. The vortex corresponding to a mass of swirling gas can be found in the lower right part of the disc. One can also observe the detached haze layer in the outer limits of the atmosphere and the north polar hood in the top left of this image.
The camera is orientated toward the leading hemisphere of the Orange Moon. North is up and tilted 25 degrees to the left. The image was obtained with the Narrow-Angle Camera of the Cassini probe on July 6, 2012 using a spectral filter sensitive to wavelengths of near-infrared radiation centered at 889 nanometers. The view was taken at a distance of about 1.7 million miles or 2.8 million kilometers from the Opaque Moon and at a Sun-Titan-probe, or phase, angle of 86 degrees. The photo was contrast enhanced and magnified by a factor of 1.5 to improve the visibility of surface or atmospheric features.

Image Credit: NASA/JPL-Caltech/Space Science Institute.


The natural color image of Saturn's largest moon Titan above reveals, in particular, the recently formed south polar vortex in the lower part of the disc. A blue detached haze layer can be clearly identified in the upper atmosphere as well. The south polar vortex was first observed in 2012. This yellowish mass of swirling gas above the south polar region may have taken shape due to seasonal factors. The southern hemisphere, currently experiencing the Autumn season, is now approaching the Winter season. The rapidly rotating vortex is expected to continue developing as the Winter season approaches in the area.
Views obtained using red, green and blue spectral filters were combined to generate this natural color image. The views were taken with the ISS Wide-Angle Camera of the Cassini probe on July 25, 2012 at a distance of about 64,000 miles or 103,000 kilometers from the Orange Moon.

Image Credit: NASA/JPL-Caltech/SSI.


The natural color view of Titan's disc above was constructed on the basis of views obtained using red, green and blue spectral filters. The images were taken with the Wide-Angle Camera of the Cassini spacecraft on June 6, 2012 at a distance of approximately 134,000 miles or 216,000 kilometers from the Opaque Moon. The camera is orientated toward the Saturn-facing side of the Orange Moon Titan and north is up and inclined 9 degrees to the right.
The camera is orientated toward the night side of Titan and the upper limits of the atmosphere can be seen thanks to sunlight scattering through the periphery of the atmosphere, engendering a ring of color revealing the disc of Saturn's largest moon.
In this view of the disc, one can observe the north polar hood in the upper part of the disc. One can notice the intriguing south polar vortex, as well, in the lower part of the disc. The development of the south polar vortex may be closely related to seasonal factors and it may continue to develop as the Winter season approaches in the southern hemisphere.

Image Credit: NASA/JPL-Caltech/SSI.


This natural color view, showing Titan partly obscured by the rings of the Gas Giant Saturn, was generated on the basis of images taken using red, green and blue spectral filters. The views were taken with the Narrow-Angle Camera of the Cassini probe on May 16, 2012, at a distance of about 1.9 million miles or 3 million kilometers from the Orange Moon. The camera is orientated toward the northern, sunlit side of the rings from just above the ring plane.
The south polar vortex of the Opaque Moon Titan, which was first identified in its atmosphere in 2012, can be seen at the bottom of the image. The south polar vortex takes the shape of a swirling mass of gas appearing yellowish around the south pole. One can also notice the famous north polar hood of Titan in the upper part of the disc which corresponds to a cap of haze appearing slightly darker than the rest of the atmosphere.
The south polar vortex may be closely related to seasonal factors. The southern hemisphere is now approaching the Winter period. The inner part of the rings appears dark near the center of this image because of the shadow cast by the Gas Giant Saturn. Let's note however that a line of illuminated Titan can be observed through the Cassini Division inside the rings in the dark portion of the rings.

Image Credit: NASA/JPL-Caltech/SSI.


The natural color image above, revealing the Opaque Moon Titan in front of the ringed planet Saturn, corresponds to a mosaic of six images (two images of red spectral filters, two images of green spectral filters and two images of blue spectral filters). The images were acquired with the Wide-Angle Camera of the Cassini spacecraft on May 6, 2012, at a distance of about 483,000 miles or 778,000 kilometers from the Orange Moon Titan. The camera is orientated toward the northern, illuminated side of the rings from just above the ring plane.
Cassini researchers have been focusing their attention on Titan's south polar area since a yellowish vortex or a mass of swirling gas appeared in its atmosphere in 2012. One can notice that the the azure blue observed in the north polar region of Saturn is now fading due to seasonal changes. In parallel, the south polar region is taking on a bluish color. The hue of the atmosphere is related to seasonal factors. The north polar region of Saturn appeared with a blue color when the Cassini/Huygens spacecraft reached the Saturn System in 2004. At that time, the northern hemisphere was experiencing the Winter season and the southern hemisphere was experiencing the Summer season.
Now, the northern hemisphere is experiencing the Spring season and the southern hemisphere is experiencing the Autumn season. The change in color is closely related to the reduced intensity of ultraviolet light and haze production in the hemisphere approaching Winter and to the increasing intensity of ultraviolet light anf haze production in the hemisphere approaching Summer. Therefore, the southern hemisphere of Saturn which is approaching the Winter season may become bluer in the future because of a lower level of haze, more direct scattering  of sunlight by the molecules of the air and the action of methane molecules in the atmosphere which tend to absorb the red part of the spectrum.

Image Credit: NASA/JPL-Caltech/SSI.


This view of Saturn's largest moon Titan reveals an atmospheric vortex evolving in the south polar region of the Opaque Moon. The vortex or the mass of swirling gas is characterized by a bright patch in the lower part of the disk. One can observe the dark, north polar hood in the upper part of the disk. Those atmospheric phenomena may be closely related to seasonal factors. A detached haze layer in the upper part of the deep, dense and opaque atmosphere can be clearly seen as well.
The view was obtained in visible blue light with the ISS Narrow-angle camera of the Cassini probe on July 18, 2012. The image was taken at a distance of about 1.9 million miles or 3 million kilometers from the Orange Moon and at a Sun-Titan-spacecraft, or phase, angle of 85 degrees. The view was contrast enhanced and magnified by a factor of 1.5 to increase the visibility of atmospheric features. The camera is orientated toward the Saturn-facing side of the Opaque Moon in this view and north is up and rotated 14 degrees to the left.

Image Credit: NASA/JPL-Caltech/Space Science Institute.


This image reveals the bright moon Enceladus which is partially eclipsed by Saturn and the Opaque moon Titan. Saturn's largest moon Titan is farther from the Cassini spacecraft than Enceladus. Therefore, the apparent diameter of Enceladus is higher than that of the Orange Moon. Enceladus appears in the upper left part of the view and Titan is in the lower right part of the image.
The Cassini probe flew by Enceladus at a distance of approximately 16,000 miles or 26,000 kilometers. The terminator between the day and night sides of the icy moon Enceladus can be observed on the far left of the moon, while the shadow of the eclipsing planet Saturn runs across the bottom. The Opaque Moon Titan is approximately 684,000 miles or 1.1 million kilometers from the probe. The camera is orientated toward the Saturn-facing sides of Enceladus and Titan and north is up.
The photo was obtained in visible light with the Wide-Angle Camera  of the Cassini spacecraft on October 1, 2011. The image was taken at a Sun-Enceladus-probe, or phase, angle of 29 degrees. The view was contrast enhanced and magnified by a factor of 1.5 to raise the visibility of the topography or of the surfaces features. One can notice, in particular, a few craters on the icy moon Enceladus which has a relatively young surface, especially in its south polar region due to cryovolcanic eruptions or geysers.

Image Credit: NASA/JPL-Caltech/Space Science Institute.


The Cassini images above correspond to false-color images taken with the Visual and Infrared Mapping Spectrometer in infrared wavelengths on May 22 and June 7, 2012. These images reveal the development of a hood of high-altitude haze forming above the south pole of the Orange Moon. The haze appears orange in this set of images. Researchers assigned the colors red, green and blue to wavelengths mostly sensitive to the stratosphere, the troposphere and surface features.
The new formation of haze appears several hundred miles or kilometers above the ground. The Cassini probe had allowed scientists to identify a north polar haze at the beginning of the Cassini mission in the Saturn System when the northern hemisphere was experiencing the Winter season. At that time, the south polar region which was experiencing the Summer season was basically clear, except for sporadic methane cloud systems in the area of Ontario Lacus. The equinox marking the end of the Summer season in the southern hemisphere and the end of the Winter season in the northern hemisphere occured in August 2009. Seasonal changes have been clearly  observed in the atmosphere with the atmospheric circulation going now from the illuminated north pole to the cooling south pole, causing downwelling above the south pole  and the formation of the same kind of hood observed over the north polar region during the Winter period in the northern hemisphere.

Image Credit: NASA/JPL-Caltech/University of Arizona/LPGNantes.


This natural color image obtained from the narrow-angle camera of the Cassini probe late on June 26, 2012 reveals a south polar vortex on Saturn's largest moon Titan. Images acquired using red, green and blue spectral filters were combined to generate this natural color image. The views were captured at a distance of approximately 301,000 miles or 484,000 kilometers from the Orange Moon. The true color image was obtained before a distant flyby of the Opaque Moon on June 27, 2012.
The south pole can be observed near the center of the image. A visible "hood" had been identified above the north pole when the Cassini spacecraft arrived in the Saturn System in 2004. The northern hemisphere was experiencing the Winter season whereas the southern hemisphere was experiencing the Summer season. As a result, much of the high northern latitudes were in darkness. A high altitude haze corresponding to a higher concentration of atmospheric molecules could be identified however thanks the solar illumination which reached the upper atmosphere of the north polar region.
A change in season occured in August 2009 with the equinox marking the start of the Spring season in the northern hemisphere and the start of the Autumn season in the southern hemisphere. The high southern latitudes are now moving into darkness as opposed to the high northern latitudes which are becoming brighter. The formation of the vortex in the south polar region may be related to the seasonal advancement toward the Winter season. It may result in the same kind of polar hood as the one observed over the north polar region.
This image has been made possible thanks to the newly inclined orbits of the Cassini probe which correspond to the next phase of the Cassini Solstice Mission. Before that orbital change, the Cassini probe was orbiting in the equatorial plane of Saturn and the views of the polar vortex between late March and mid-May were acquired from over the equator of the Orange Moon. The images revealed a brightening or yellowing of the detached haze layer on the edge of the visible disk of the Opaque Moon, over the south polar region. The new views seem to reveal open cell convection where air sinks in the center of the cell and goes up at the edge, generating clouds at cell edges.

Image Credit: NASA/JPL-Caltech/Space Science Institute.


The radar image above corresponds to a portion of the Radar Swath of Titan's landscape acquired with the Radar Mapper of the Cassini spacecraft during the T-64 Flyby of December 28, 2009. The radar antenna was orientated toward the Opaque Moon at an altitude of 955 kilometers or 593 miles during the closest approach. The view has been processed  with a resolution of 128 pixels per degree.
One can notice several dark and uniform patches. They may correspond to lakes of liquid ethane and methane. A topographic feature in the lower left part of the view seems to correspond to a partially dried-up lake because there are variations in brightness within the presumed dried-up lake and  because there are apparent erosional processes within its rims.

Post Scriptum: The scale was incorporated by Marc Lafferre.
Radar Image Credit:
NASA/JPL-Caltech.


The radar image above corresponds to a portion of the Radar Swath of Titan's landscape obtained with the Radar Mapper of the Cassini probe during the T-59 Flyby of July 24, 2009. The radar antenna was orientated toward the Opaque Moon at an altitude of 955 kilometers or 593 miles during the closest approach. The view has been processed  with a resolution of 128 pixels per degree.
The dark area may correspond to a basin or a canyon. Is the dark area filled with liquids ? The variations in darkness within the dark area imply a low level of liquids, erosional processes or strong evaporation processes.

Post Scriptum: The scale was incorporated by Marc Lafferre.
Radar Image Credit:
NASA/JPL-Caltech.


The radar image above corresponds to a portion of the Radar Swath of Titan's landscape acquired with the Radar Mapper of the Cassini probe during the T-36 Flyby of July 8, 2009. The radar antenna was orientated toward the Orange Moon at an altitude of 965 kilometers or 600 miles during the closest approach. The view has been processed  with a resolution of 128 pixels per degree.
One can notice, in particular, a dark and uniform area with a well-defined boundary in the left part of the dark area. This dark and uniform area corresponds to a body of liquids. A dark drainage channel connected to the lake can be noticed as well.

Post Scriptum: The scale was incorporated by Marc Lafferre.
Radar Image Credit:
NASA/JPL-Caltech.


The radar image above corresponds to a portion of the Radar Swath of Titan's landscape taken with the Radar Mapper of the Cassini probe during the T-28 Flyby of April 10, 2007. The radar antenna was orientated toward the Orange Moon at an altitude of 990 kilometers or 615 miles during the closest approach. The view has been processed  with a resolution of 128 pixels per degree.
A network of drainage channels can be clearly identified here. A lake can be found in the upper part of the view as well. The lake and the rivers may be composed of a mixture of liquid ethane and liquid methane.

Post Scriptum: The scale was incorporated by Marc Lafferre.
Radar Image Credit:
NASA/JPL-Caltech.


The radar image above corresponds to a portion of the Radar Swath of Titan's landscape obtained with the Radar Mapper of the Cassini probe during the T-17 Flyby of September 07, 2006. The radar antenna was orientated toward the Opaque Moon at an altitude of 1,000 kilometers or 621 miles during the closest approach. The view has been processed  with a resolution of 128 pixels per degree.
A dark circular feature surrounded by a bright material can be seen, in particular. It may represent a caldera, a cryovolcano but it may also be an impact crater.

Post Scriptum: The scale was incorporated by Marc Lafferre.
Radar Image Credit:
NASA/JPL-Caltech.


The radar image above corresponds to a portion of the Radar Swath of Titan's landscape obtained with the Radar Mapper of the Cassini probe during the T-61 Flyby of August 25, 2009. The radar antenna was orientated toward the Orange Moon at an altitude of 970 kilometers or 603 miles during the closest approach. The view has been processed  with a resolution of 128 pixels per degree.
One can observe, in particular, a dark circular feature surrounded by a bright material. Is it a caldera or a cryovolcano ? The viewer can appreciate the action of prevailing winds on the shape of the dunes which can be deflected by bright topographic obstacles.

Post Scriptum: The scale was incorporated by Marc Lafferre.
Radar Image Credit:
NASA/JPL-Caltech.


The radar image above corresponds to a portion of the Radar Swath of Titan's landscape taken with the Radar Mapper of the Cassini spacecraft during the T-57 Flyby of June 22, 2009. The radar antenna was orientated toward the Opaque Moon at an altitude of 955 kilometers or 593 miles during the closest approach. The view has been processed  with a resolution of 128 pixels per degree.
One can notice, in particular, a dark, uniform area which may correspond to a lake of liquid hydrocarbons such as methane and ethane.

Post Scriptum: The scale was incorporated by Marc Lafferre.
Radar Image Credit:
NASA/JPL-Caltech.


The radar image above corresponds to a portion of the Radar Swath of Titan's landscape taken with the Radar Mapper of the Cassini spacecraft during the T-56 Flyby of June 6, 2009. The radar antenna was orientated toward the Orange Moon at an altitude of 965 kilometers or 599 miles during the closest approach. The view has been processed  with a resolution of 128 pixels per degree.
This area reveals an irregular landscape with canyons, hills or mountains. The bright areas likely correspond to mountains or hills.

Post Scriptum: The scale was incorporated by Marc Lafferre.
Radar Image Credit:
NASA/JPL-Caltech.


The radar image above corresponds to a portion of the Radar Swath of Titan's landscape obtained with the Radar Mapper of the Cassini probe during the T-55 Flyby of May 21, 2009. The radar antenna was orientated toward the Orange Moon at an altitude of 965 kilometers or 599 miles during the closest approach. The view has been processed  with a resolution of 128 pixels per degree.
One can notice that the orientation of the Seif Dunes is influenced by bright features which act as topographic obstacles to the action of winds on the formation of the dunes.

Post Scriptum: The scale was incorporated by Marc Lafferre.
Radar Image Credit:
NASA/JPL-Caltech.


The radar image above corresponds to a portion of the Radar Swath of Titan's landscape acquired with the Radar Mapper of the Cassini probe during the T-50 Flyby of February 7, 2009. The radar antenna was orientated toward the Opaque Moon at an altitude of 960 kilometers or 597 miles during the closest approach. The view has been processed  with a resolution of 128 pixels per degree.
One can clearly notice the typical Seif Dunes observed in the dark areas of the low latitudes of Saturn's largest moon. Those linear and parallel dunes are shaped by prevailing winds.

Post Scriptum: The scale was incorporated by Marc Lafferre.
Radar Image Credit:
NASA/JPL-Caltech.


The radar image above corresponds to a portion of the Radar Swath of Titan's landscape taken with the Radar Mapper of the Cassini probe during the T-49 Flyby of December 21, 2008. The radar antenna was orientated toward the Orange Moon at an altitude of 970 kilometers or 684 miles during the closest approach. The view has been processed  with a resolution of 128 pixels per degree.
One can observe here the famous Cat Scratches within the dark areas. They correspond to Seif Dunes or linear and parallel dunes extending over long distances, similar to the dunes observed in the Namib Desert on our planet.

Post Scriptum: The scale was incorporated by Marc Lafferre.
Radar Image Credit:
NASA/JPL-Caltech.


The radar image above corresponds to a portion of the Radar Swath of Titan's landscape obtained with the Radar Mapper of the Cassini probe during the T-48 Flyby of December 5, 2008. The radar antenna was orientated toward the Opaque Moon at an altitude of 960 kilometers or 597 miles during the closest approach. The view has been processed  with a resolution of 128 pixels per degree.
Does the dark circular feature correspond to an impact crater or does it correspond to a cryovolcanic feature or a caldera ?

Post Scriptum: The scale was incorporated by Marc Lafferre.
Radar Image Credit:
NASA/JPL-Caltech.


The radar image above corresponds to a portion of the Radar Swath of Titan's landscape obtained with the Radar Mapper of the Cassini probe during the T-44 Flyby of May 28, 2008. The radar antenna was orientated toward the Orange Moon at an altitude of 1,400 kilometers or 870 miles during the closest approach. The view has been processed  with a resolution of 128 pixels per degree.
One can notice bright, sinuous channels connected to a bright, irregular area. The boundary between the dark area and the bright area may correspond to the rims of a giant impact crater.

Post Scriptum: The scale was incorporated by Marc Lafferre.
Radar Image Credit:
NASA/JPL-Caltech.


The radar image above corresponds to a portion of the Radar Swath of Titan's landscape acquired with the Radar Mapper of the Cassini spacecraft during the T-43 Flyby of May 12, 2008. The radar antenna was orientated toward the Orange Moon at an altitude of 1,000 kilometers or 621 miles during the closest approach. The view has been processed  with a resolution of 128 pixels per degree.
On can observe, in particular, a bright circular feature which may correspond to the rims of an impact crater. However, it may also correspond to a caldera or a collapsed cryovolcano.

Post Scriptum: The scale was incorporated by Marc Lafferre.
Radar Image Credit:
NASA/JPL-Caltech.


The radar image above corresponds to a portion of the Radar Swath of Titan's landscape obtained with the Radar Mapper of the Cassini probe during the T-39 Flyby of December 20, 2007. The radar antenna was orientated toward the Opaque Moon at an altitude of 970 kilometers or 602 miles during the closest approach. The view has been processed with a resolution of 128 pixels per degree.
One can notice, in this image, a dark, wide and sinuous channel which may correspond to a drainage channel filled with liquid hydrocarbons such as ethane and methane.

Post Scriptum: The scale was incorporated by Marc Lafferre.
Radar Image Credit:
NASA/JPL-Caltech.


The radar images of Titan's landscape above were captured with the radar instrument of the Cassini probe during the T-36 Flyby of October 2, 2007. The radar antenna was orientated toward the Orange Moon at an altitude of 975 kilometers or 605 miles during the closest approach. The view has been processed with a resolution of 128 pixels per degree.

Radar Image Credit: NASA/JPL-Caltech.


The radar image above corresponds to the Radar Swath acquired by the Radar Mapper of the Cassini probe during the T-30 Flyby of Saturn's largest moon Titan on May 12, 2007. The radar antenna was orientated toward the Opaque Moon at an altitude of 960 kilometers or 597 miles during the closest approach. The view has been processed with a resolution of 128 pixels per degree.
One can observe a dark and uniform area to the left of the radar swath. This dark area corresponds to a pool of liquids. Several bright islands can be observed within the lake and the irregular coastline can be clearly identified as well. The lakes or seas in the north polar region may be mostly composed of ethane and methane.

Post Scriptum: The scale was incorporated by Marc Lafferre.
Radar Swath Credit: NASA/JPL-Caltech.


The radar view above corresponds to the Radar Swath taken with the Radar Mapper of the Cassini spacecraft during the T-29 Flyby of the Orange Moon Titan on April 26, 2007. The radar antenna was orientated toward the Opaque Moon at an altitude of 980 kilometers or 609 miles during the closest approach. The radar swath has been processed with a resolution of 128 pixels per degree.

Radar Image Credit: NASA/JPL-Caltech.


The radar image of Titan's landscape above corresponds to a portion of the radar swath obtained with the Radar Mapper of the Cassini spacecraft during the flyby of February 22, 2007. The radar antenna was orientated toward the Orange Moon at an altitude of 1,000 kilometers or 621 miles during the closest approach. The radar swath from which this view was extracted has been processed with a resolution of 128 pixels per degree.
One can observe a dark area corresponding to a lake likely composed of methane and ethane. A dark sinuous channel can be clearly identified from the lake to the top left of the view.

Post Scriptum: The scale was incorporated by Marc Lafferre.
Radar Image Credit: NASA/JPL-Caltech.


This view of the disk of Saturn's largest moon Titan reveals the detached, high-altitude haze layer encircling the Orange Moon which is covered by a deep, thick and opaque atmosphere. The upper layers of the atmosphere are illuminated by sunlight scattering through the gas blancket and generating a halo-like ring. The camera is orientated toward the Saturn-facing side of the Opaque Moon. This side is partially illuminated by sunlight due to the position of our star. Complex photochemical processes occur in the upper part of the atmosphere under the action of ultraviolet light which tends to break up methane molecules which recombine to form new organic molecules such as acetylene, ethylene or radicals.
North on Titan is toward the top of the view and rotated 29 degrees to the left. The image was obtained in visible green light with the Wide-Angle Camera of the Cassini probe on January 30, 2012. The photo was acquired at a distance of about 123,000 miles or 197,000 kilometers from the Orange Moon and at a Sun-Titan-spacecraft, or phase, angle of 162 degrees.

Image Credit: NASA/JPL-Caltech/Space Science Institute


The image of Titan's disc above was obtained with the ISS Wide-Angle Camera of the Cassini spacecraft on January 31, 2012 using a spectral filter sensitive to wavelengths of near-infrared radiation centered at 890 nanometers. The image was acquired at a distance of approximately 130,000 miles or 210,000 kilometers from the Orange Moon and at a Sun-Titan-probe, or phase, angle of 24 degrees. The camera is orientated toward the anti-Saturn side of the Opaque Moon. North on Saturn's largest moon is upward and rotated 29 degrees to the right.
One can notice a brightness dichotomy between the southern portion of the moon and the northern portion of the moon. The southern portion appears darker here. The southern hemisphere of Titan is experiencing the Autumn season since August 2009 whereas the northern hemisphere is experiencing the Spring season. The hemispheric brightness dichotomy appears to be closely related to seasonal factors. The spectral filter used in this image is sensitive to absorption of certain wavelengths of light by the methane present in the atmosphere of the Orange Moon. The upper part of the disk reveals the north polar hood of the moon where a large cloud system has been clearly identified.

Image Credit: NASA/JPL-Caltech/Space Science Institute


A recent research reveals striking similarities between Ontario Lacus, the largest body of liquids in the south polar region of Saturn's largest moon Titan and Etosha Pan, a salt pan forming a part of the Kalahari Basin in the north of Namibia.
The image in the left part of the mosaic above corresponds to a radar view of the dark Ontario Lacus obtained with the radar instrument of the Cassini spacecraft on January 12, 2010. The image in the right part of the mosaic corresponds to the Etosha Pan. The view was acquired by a NASA and USGS Landsat satellite on January 21, 2003. The arrow in each portion indicates the north direction.
The Etosha Pan covers an area  approximately 75 by 40 miles (120 by 65 kilometers) whereas Ontario Lacus is slightly bigger with a surface area of about 140 by 47 miles (230 by 75 kilometers). The south part of Ontario Lacus appears brighter suggesting a lower level of liquid hydrocarbons than the north part. Linear landforms can be identifed inside Ontario Lacus.
The salt Pan "Etosha Pan" is a lake bed, mostly dry, that probably lost a large portion of its water content following a natural deflection, triggered by tectonic movements, of a river channel which used to fuel the lake with water. Heavy rainfall can trigger a rapid rise in the water level of Etosha Pan. The layers of water which evaporate leave sediments like tide marks showing the previous extent of the water.

Image Credit: NASA/JPL-Caltech and NASA/USGS  


This image obtained in visible green light with the Narrow-Angle Camera of the Cassini probe on March 12, 2012 reveals the bright, white moon Enceladus in front of Saturn's largest moon Titan as well as the rings of the Gas Giant.
Enceladus is well know for its highly reflective surface and for its geysers or jets of water ice and vapor taking shape in the south polar region of the icy moon. Those geysers suggest the presence of a subsurface sea rich in organics. The Opaque Moon Titan is well known for its deep, thick and opaque atmosphere and for its lakes and seas of hydrocarbons (methane, ethane...) in the south polar region and in the north polar region.
The small moon Enceladus, appearing in the center of the image, is only 313 miles or 504 kilometers across whereas the giant moon Titan is 3,200 miles or 5,150 kilometers across. Titan is moving well beyond the rings and Enceladus.
The view was taken at a distance of about 600,000 miles or 1 million kilometers from Enceladus and at a Sun-Enceladus-spacecraft, or phase, angle of 36 degrees. The camera is orientated toward the anti-Saturn side of Enceladus and the Saturn-facing side of the Orange Moon Titan. The northern, illuminated side of the rings of Saturn is observed from just above the ringplane.

Image Credit: NASA/JPL-Caltech/Space Science Institute  


This natural color view of Saturn's largest moon Titan, reminiscent of a moving tennis ball, reveals its orange atmosphere, the dark north polar hood or vortex as well as a blue detached haze layer in the upper part of the atmosphere. The blue haze can be clearly seen above the north polar region and above the south pole at the bottom of the image. Recent images acquired from the Cassini spacecraft suggest that the north polar vortex is beginning to flip from north to south. The atmospheric dynamics and meteorological phenomena may be closely related to seasonal changes.
The camera is orientated toward the anti-Saturn side of the Opaque Moon and north is up. Images obtained using red, green and blue spectral filters were combined to generate this natural color view. The views were captured with the Wide-Angle Camera of the Cassini spacecraft on January 30, 2012 at a distance of about 119,000 miles or 191,000 kilometers from Titan.

Image Credit: NASA/JPL-Caltech/Space Science Institute  


This near-infrared view reveals the Ringed Planet Saturn as well as its largest moon Titan, 3,200 miles or 5,150 kilometers across, in the right part of the image below the rings. Prometheus can be noticed, as well, just above the rings in the far upper right of the view. The tiny moon Prometheus, about 53 miles or 86 kilometers across, appears as a tiny white spot.
The shadow cast by the bright, elongated moon Prometheus can be observed as a small black speck on the Gas Giant on the far left of the view, between the shadows cast by the main rings and the thin F ring. The shadow of the small moon Pandora, about 81 kilometers or 50 miles across, can be observed, as well, on the Gas Giant south of the shadows of all the rings, below the center of the view towards the right side of Saturn.
The camera of the Cassini probe is orientated toward the southern, unilluminated side of the rings from approximately 1 degree below the ringplane. The image was obtained  with the wide-angle camera of the Cassini probe on January 5, 2012 using a spectral filter sensitive to wavelengths of near-infrared radiation centered at 752 nanometers. The image was taken at a distance of about 426,000 miles or 685,000 kilometers from the Gas Giant and at a Sun-Titan-spacecraft, or phase, angle of 20 degrees.

Image Credit: NASA/JPL-Caltech/Space Science Institute


The artistic view above unveils a model of the internal structure of Saturn's largest moon Titan, developed by Dominic Fortes of University College London, England on the basis of data from Cassini's radio science experiment.
The artistic image shows the Cassini spacecraft performing a targeted flyby over Titan's cloudtops. One can notice the Gas Giant Saturn and the icy moon Enceladus on the horizon, appearing at upper right.
The model is based on the assumption that the sphere is fully differentiated, which implies that the denser core of Titan has separated from its outer parts.
The core is believed to be composed of water-bearing rocks. The core is thought to be covered by a high-pressure ice layer. A subsurface ocean may exist between the mantle consisting of water ice and the high-pressure ice layer closer to the core. The soil and the atmosphere of Titan may be rich in organics or hydrocarbons.

Image Credit: A. D. Fortes/UCL/STFC


The false-color images above taken by the Visual and Infrared Mapping Spectrometer (VIMS) of the Cassini spacecraft reveal the evolution of the cloud systems in the north polar region of Saturn's largest moon, Titan from 2006 to 2009. One can notice, in particular, a dissolving cloud cover in the high latitudes of the northern hemisphere due to the seasonal changes.
A relationship can be established between the amount of clouds in the north polar region and the seasonal factors. In August 2009, the equinox occured on Titan, marking the end of the winter season and the start of the spring season in the northern hemisphere. Each Titanian season lasts approximately 7 Terrestrial years. One can observe that, in 2006, the north polar cloud system appeared dense and opaque. By contrast, the north polar cloud system appeared much thinner and patchier in 2009 during the transition period between the winter season and the spring season in the northern hemisphere.
Thanks to a lower level of cloud cover or dissipating clouds, planetary scientists were able to identify the underlying northern lakes and seas such as the dark Kraken Mare. The seas, lakes and rivers in the northern hemisphere are believed to be composed of liquid hydrocarbons such as methane and ethane.
The VIMS views were colorized with red, green and blue colors assigned to the parts of the infrared spectrum around 5 micrometers, 2.8 micrometers and 2.03 micrometers, respectively. The images generate a kind of time-lapse series from December 28, 2006 to June 6, 2009, from the 23rd, 24th, 30th,  43rd, 44th, 45th, 52nd, 53rd, 55th and 57th time the Cassini probe flew by the Orange Moon.
The mosaic in the lower part of the table shows pairs of images. The false-color images of the clouds can be seen in the left part of each couple of views. The same views are re-projected onto a globe of the Opaque Moon on the right. The global view reveals the north pole of the moon at the center. Other parts of the globe are filled in on the basis of data obtained with the imaging cameras and the radar instrument of the Cassini probe.

Image Credit, upper view: NASA/JPL-Caltech/University of Arizona/CNRS/LPGNantes
Image Credit, lower view: NASA/JPL-Caltech/University of Arizona/CNRS/LPGNantes/SSI


The view above shows the icy moon Rhea moving in front of Saturn's largest moon Titan. One can clearly notice the cratered surface of the bright Rhea and the opaque, orange atmosphere of Titan. The detached-haze layer of the deep atmosphere of Titan is also clearly visible, here.
Rhea is largely smaller than Titan: its diameter is only 949 miles or 1,528 kilometers compared to 3,200 miles or 5,150 kilometers for Titan. Rhea is orbiting closer to Saturn than Titan with a semi-major axis of 527,108 km (approximately 328,000 miles) compared to 1,221,870 km (approximately 760,000 miles) for Titan.
The illuminated terrain observed here appears on the leading hemisphere of Rhea and Titan. North on each moon is up and rotated 13 degrees to the left. The edge of the visible disk of Rhea is slightly overexposed in this image.
This image was obtained in visible green light with the narrow-angle camera of the Cassini probe on December 10, 2011. The view was taken at a distance of about 1.2 million miles or 2 million kilometers from the Orange Moon and at a Sun-Titan-spacecraft, or phase, angle of 109 degrees. The image was captured at a distance of approximately 810,000 miles or 1.3 million kilometers from Rhea and at a Sun-Rhea-probe, or phase, angle of 109 degrees.

Image Credit: NASA/JPL-Caltech/Space Science Institute


The mosaic above shows four areas of dune  fields on Earth and on Titan. The topographic portions have been processed to show the same spatial scale and stretch. The images of the Belet dunes and the Fensal dunes on the left part of the mosaic correspond to radar views obtained by the radar instrument of the Cassini probe on October 28, 2005 and April 10, 2007. The image of the Oman dunes, corresponding to dunes in the Rub' al Khali or Empty Quarter, as well as the image of the Kalahari dunes, in the Namib desert, were taken by the Advanced Spaceborne Thermal Emission and Reflection Radiometer (ASTER), an instrument aboard NASA's Terra satellite.
The dunes on Titan are the dark streaks of the radar images. One can notice that the area of Fensal appears much brighter than the area of Belet. The difference in appearance may be explained by a thinner sand cover in the interdune areas of  Fensal. One can also notice that the areas between the dunes are wider in Fensal than in the dune field of Belet. The dunes on Titan are 0.6 to 1.2 miles wide or 1 to 2 kilometers wide and the areas between the dunes represented by bright streaks in the radar views are 0.6 miles to 2.5 miles wide or 1 to 4 kilometers wide.
It appears that the shape and the size of the dunes are intimately linked to altitude and latitude on Titan. The dunes tend to be thinner and more widely separated in areas of higher altitude or higher latitude. Thus Fensal has less sand than Belet with narrower dunes and thinner blankets of sand between them because Fensal is found at a higher altitude and latitude than Belet. The Fensal dunes are relatively similar to the Kalahari dunes in South Africa and Namibia where there is a limited amount of sediment or sand. By contrast, the Belet dunes resemble the Oman dunes in Yemen and Saudi Arabia where there is a large amount of sand or sediment.
The difference in the size of the dunes between Belet and Fensal may be explained by meteorological phenomena. The high latitudes tend to be more wet than the lower latitudes so that the sand grains likely made of hydrocarbons are sticky, heavier and less mobile. As a result, the dunes will be thinner. Due to the obliquity of Titan, the high latitudes of Titan experience more rain, more evaporation and condensation than the low latitudes. Rainfall may be rare in the low latitudes so that the soil is relatively dry with a large amount of volatile compounds such as sand grains of hydrocarbons.
The dunes in the southern hemisphere may be more pronounced because the rainy season corresponding to summer may be shorter and warmer leaving the soil less moist. This climate particularity is related to the elliptical orbit of Titan around the Sun. Titan receives more solar energy at perihelion than at aphelion. At perihelion, the southern hemisphere experiences the warm season in which the area will receive short and intense precipitation. This warm season in the southern hemisphere is shorter than in the northern hemisphere because Titan moves faster around the Sun (Kepler's Law of Areas) during that period. Therefore, the dry season will be longer and the dunes will likely be thicker.

 Image Credit: NASA/JPL-Caltech, and NASA/GSFC/METI/ERSDAC/JAROS and U.S./Japan ASTER Science Team  


The image above shows the icy moon Tethys, the Opaque Moon Titan as well as a portion of Saturn's rings. The Orange Moon Titan appears beyond the rings in the left part of the view and the bright Tethys which is moving closer to Saturn appears beyond the rings in the middle of the view.
The image was obtained in visible red light with the narrow-angle camera of the Cassini probe on December 7, 2011. The view was taken at a distance of about 1.4 million miles or 2.2 million kilometers from Tethys and 1.9 million miles or 3.1 million kilometers from Saturn's largest moon Titan.
The camera is orientated toward the Saturn-facing sides of Tethys and Titan. The northern, sunlit side of the rings of the Gas Giant can be observed from an angle of less than one degree above the ring plane.
Tethys is largely smaller than Titan with a mean diameter of only 660 miles or 1,062 kilometers compared to 3,200 miles or 5,150 kilometers for Titan.

Image Credit: NASA/JPL-Caltech/Space Science Institute


Titan Images 2011
Titan Images 2010
Titan Images 2009
Titan Images 2008
Titan Images 2007
Titan Images 2006
Titan Images 2005, 2004

Back to main page