Titan Images 2010

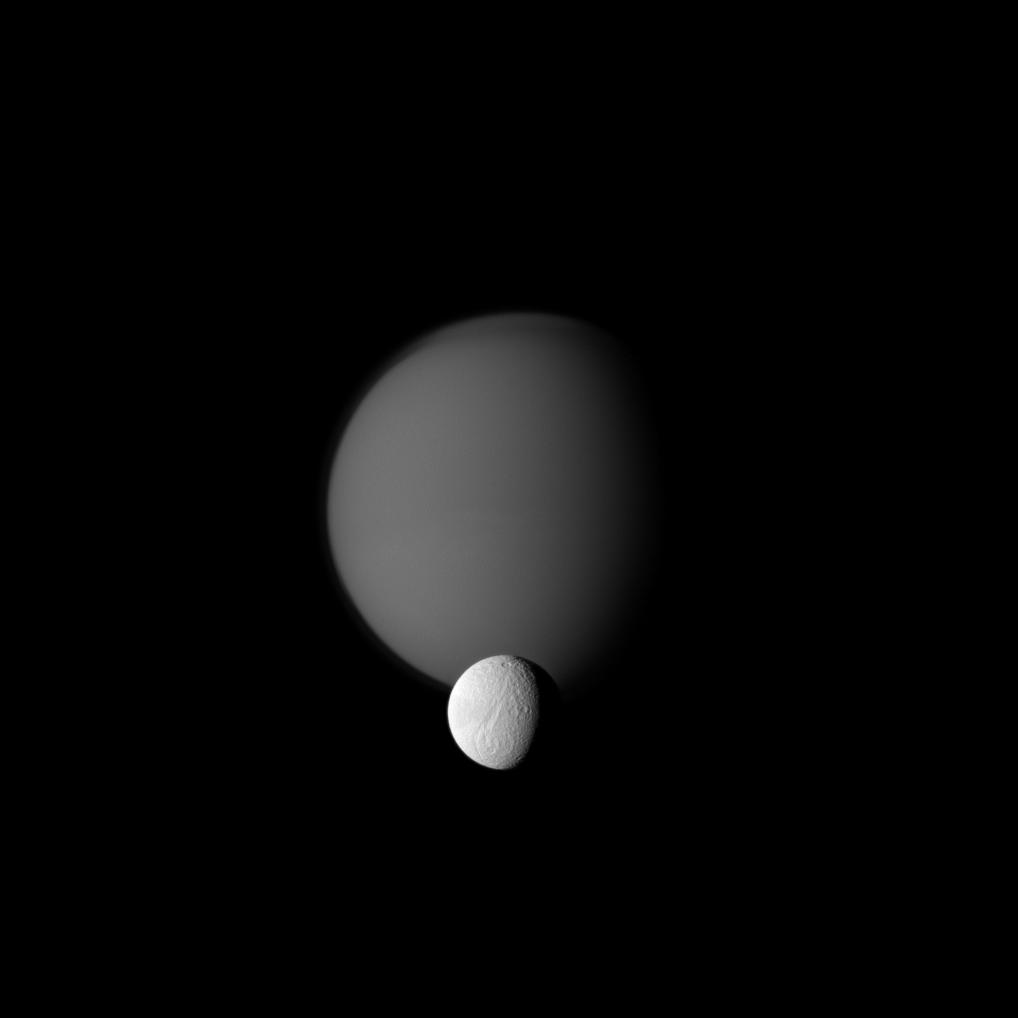
This image shows the icy moon Tethys in the foreground and Saturn's largest moon, Titan in the background. One can notice in this orbital configuration the bright, cratered surface of Tethys as well as the topographic fracture Ithaca Chasma running approximately north-south for more than 1,000 kilometers or 620 miles.
The opaque, deep, thick and hazy atmosphere of Titan appears darker in the north polar region than in the rest of the globe. This dark blanket of the north polar region is known as the North Polar Hood. The detached, high-altitude haze layer of Titan's atmosphere can be observed, as well.
The camera is pointing toward the Saturn-facing sides of the Orange Moon and the icy moon Tethys. The view was obtained in visible green light with the Cassini probe narrow-angle camera on October 18, 2010. The image was acquired at a distance of about 2.5 million kilometers or 1.6 million miles from Titan and at a Sun-Titan-spacecraft, or phase, angle of 55 degrees. The view was captured at a distance of about 1.5 million kilometers or 930,000 miles from Tethys and at a Sun-Tethys-probe, or phase, angle of 55 degrees. Titan is 5,150 kilometers or 3,200 miles in diameter whereas Tethys is only 1,062 kilometers or 660 miles in diameter.

Image Credit: NASA/JPL/Space Science Institute


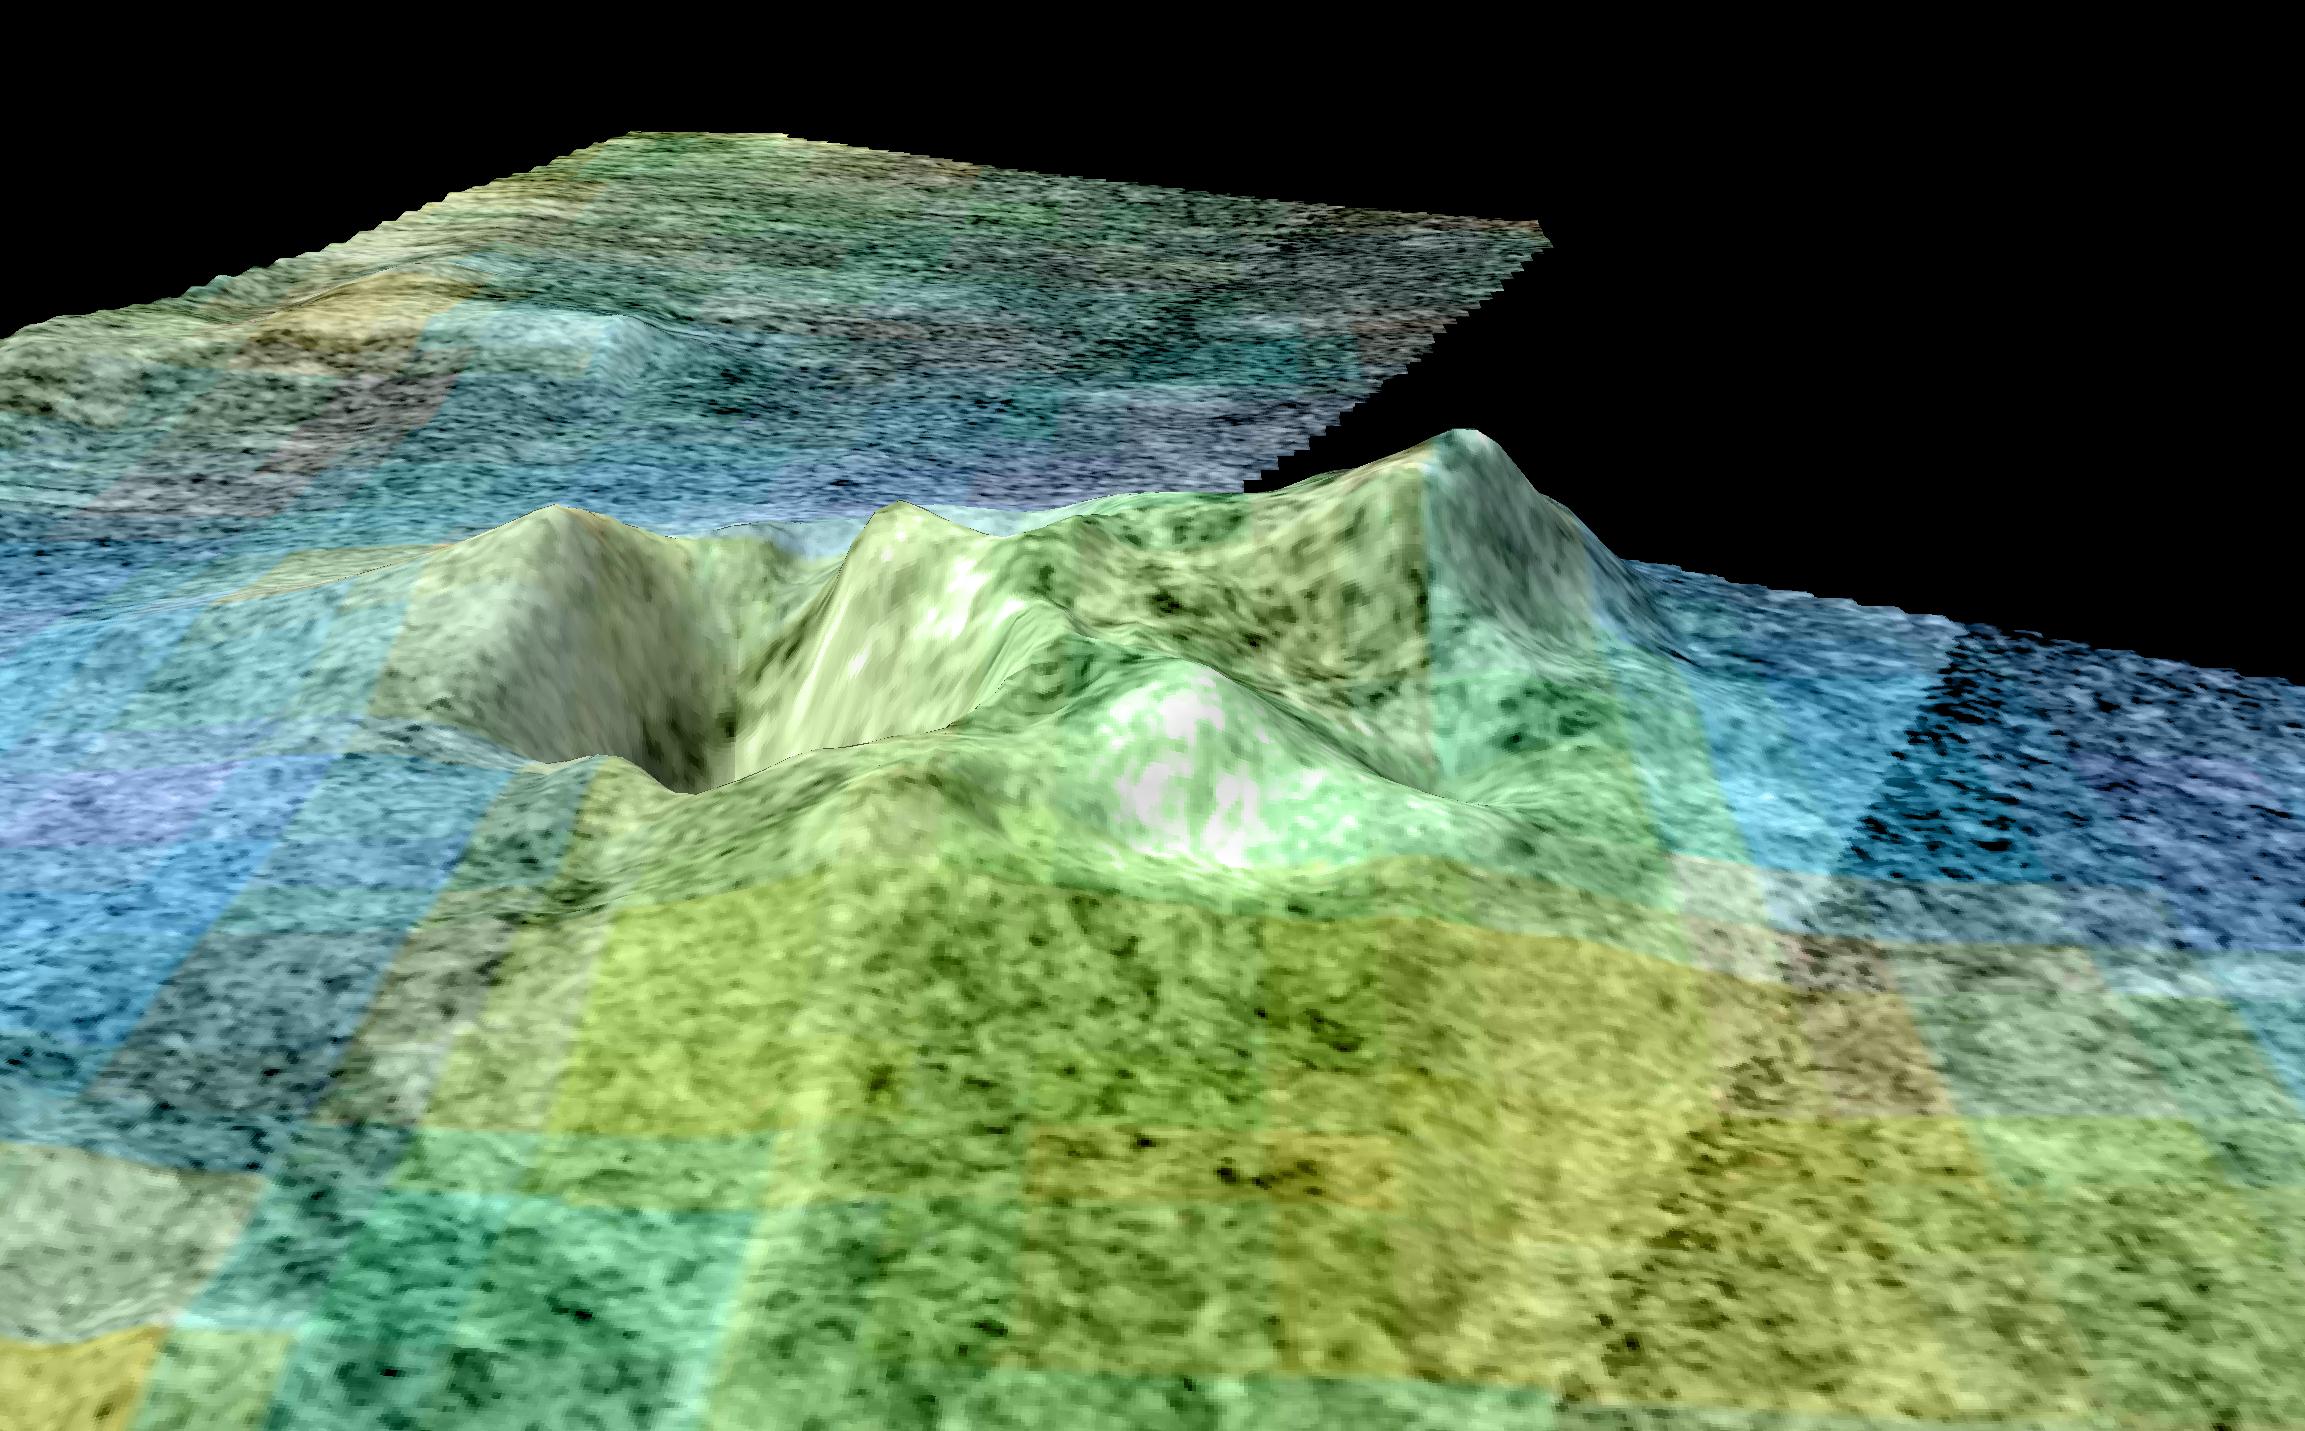
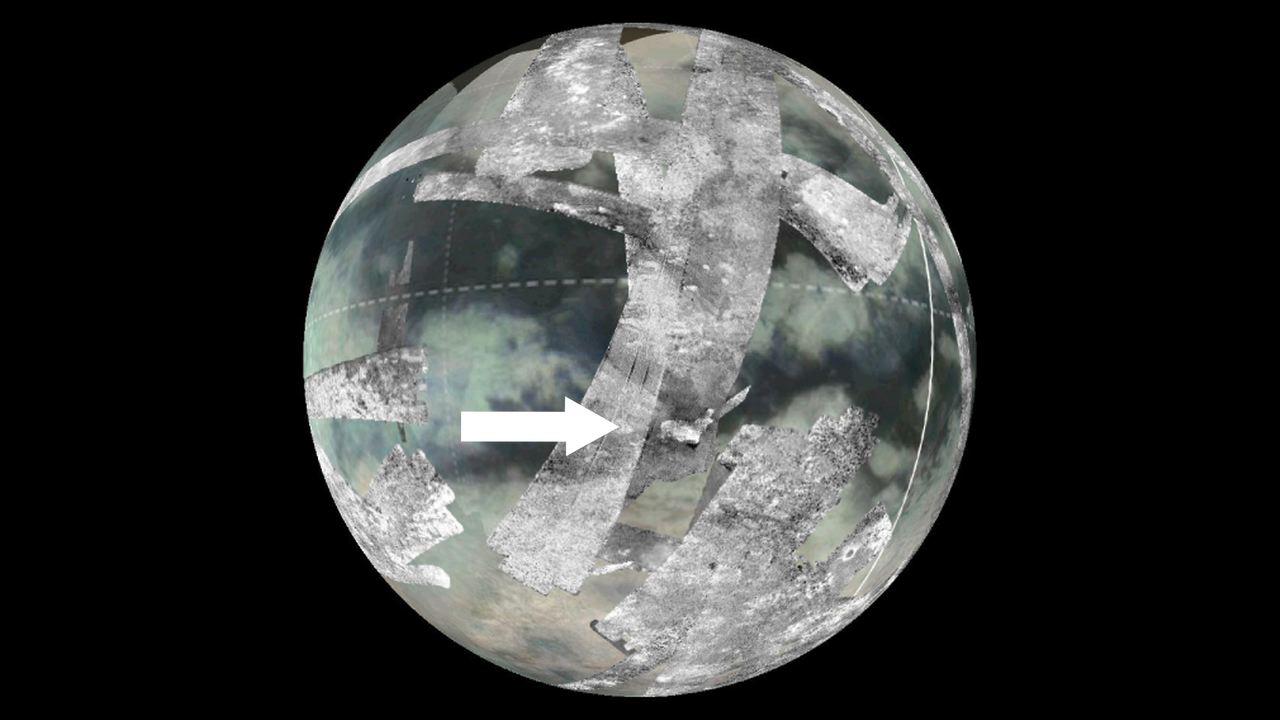
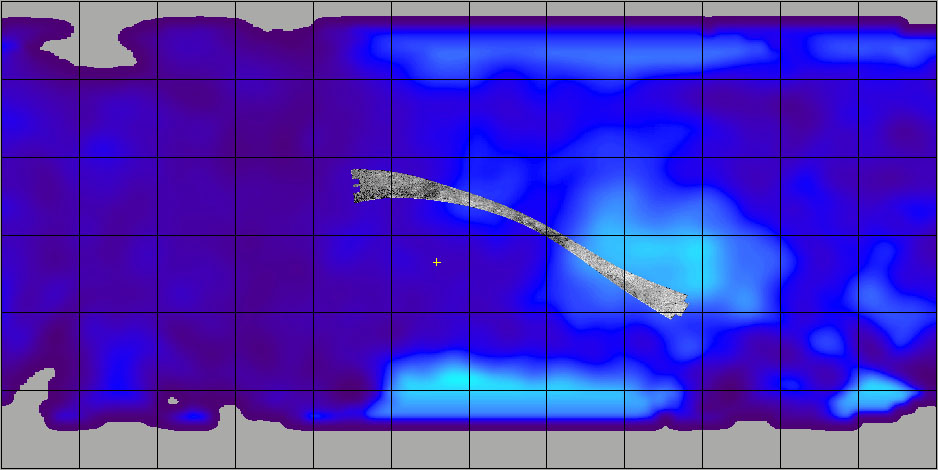
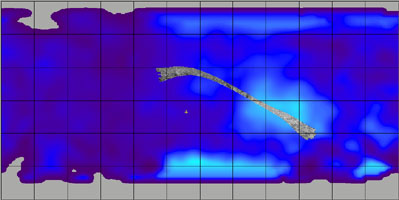
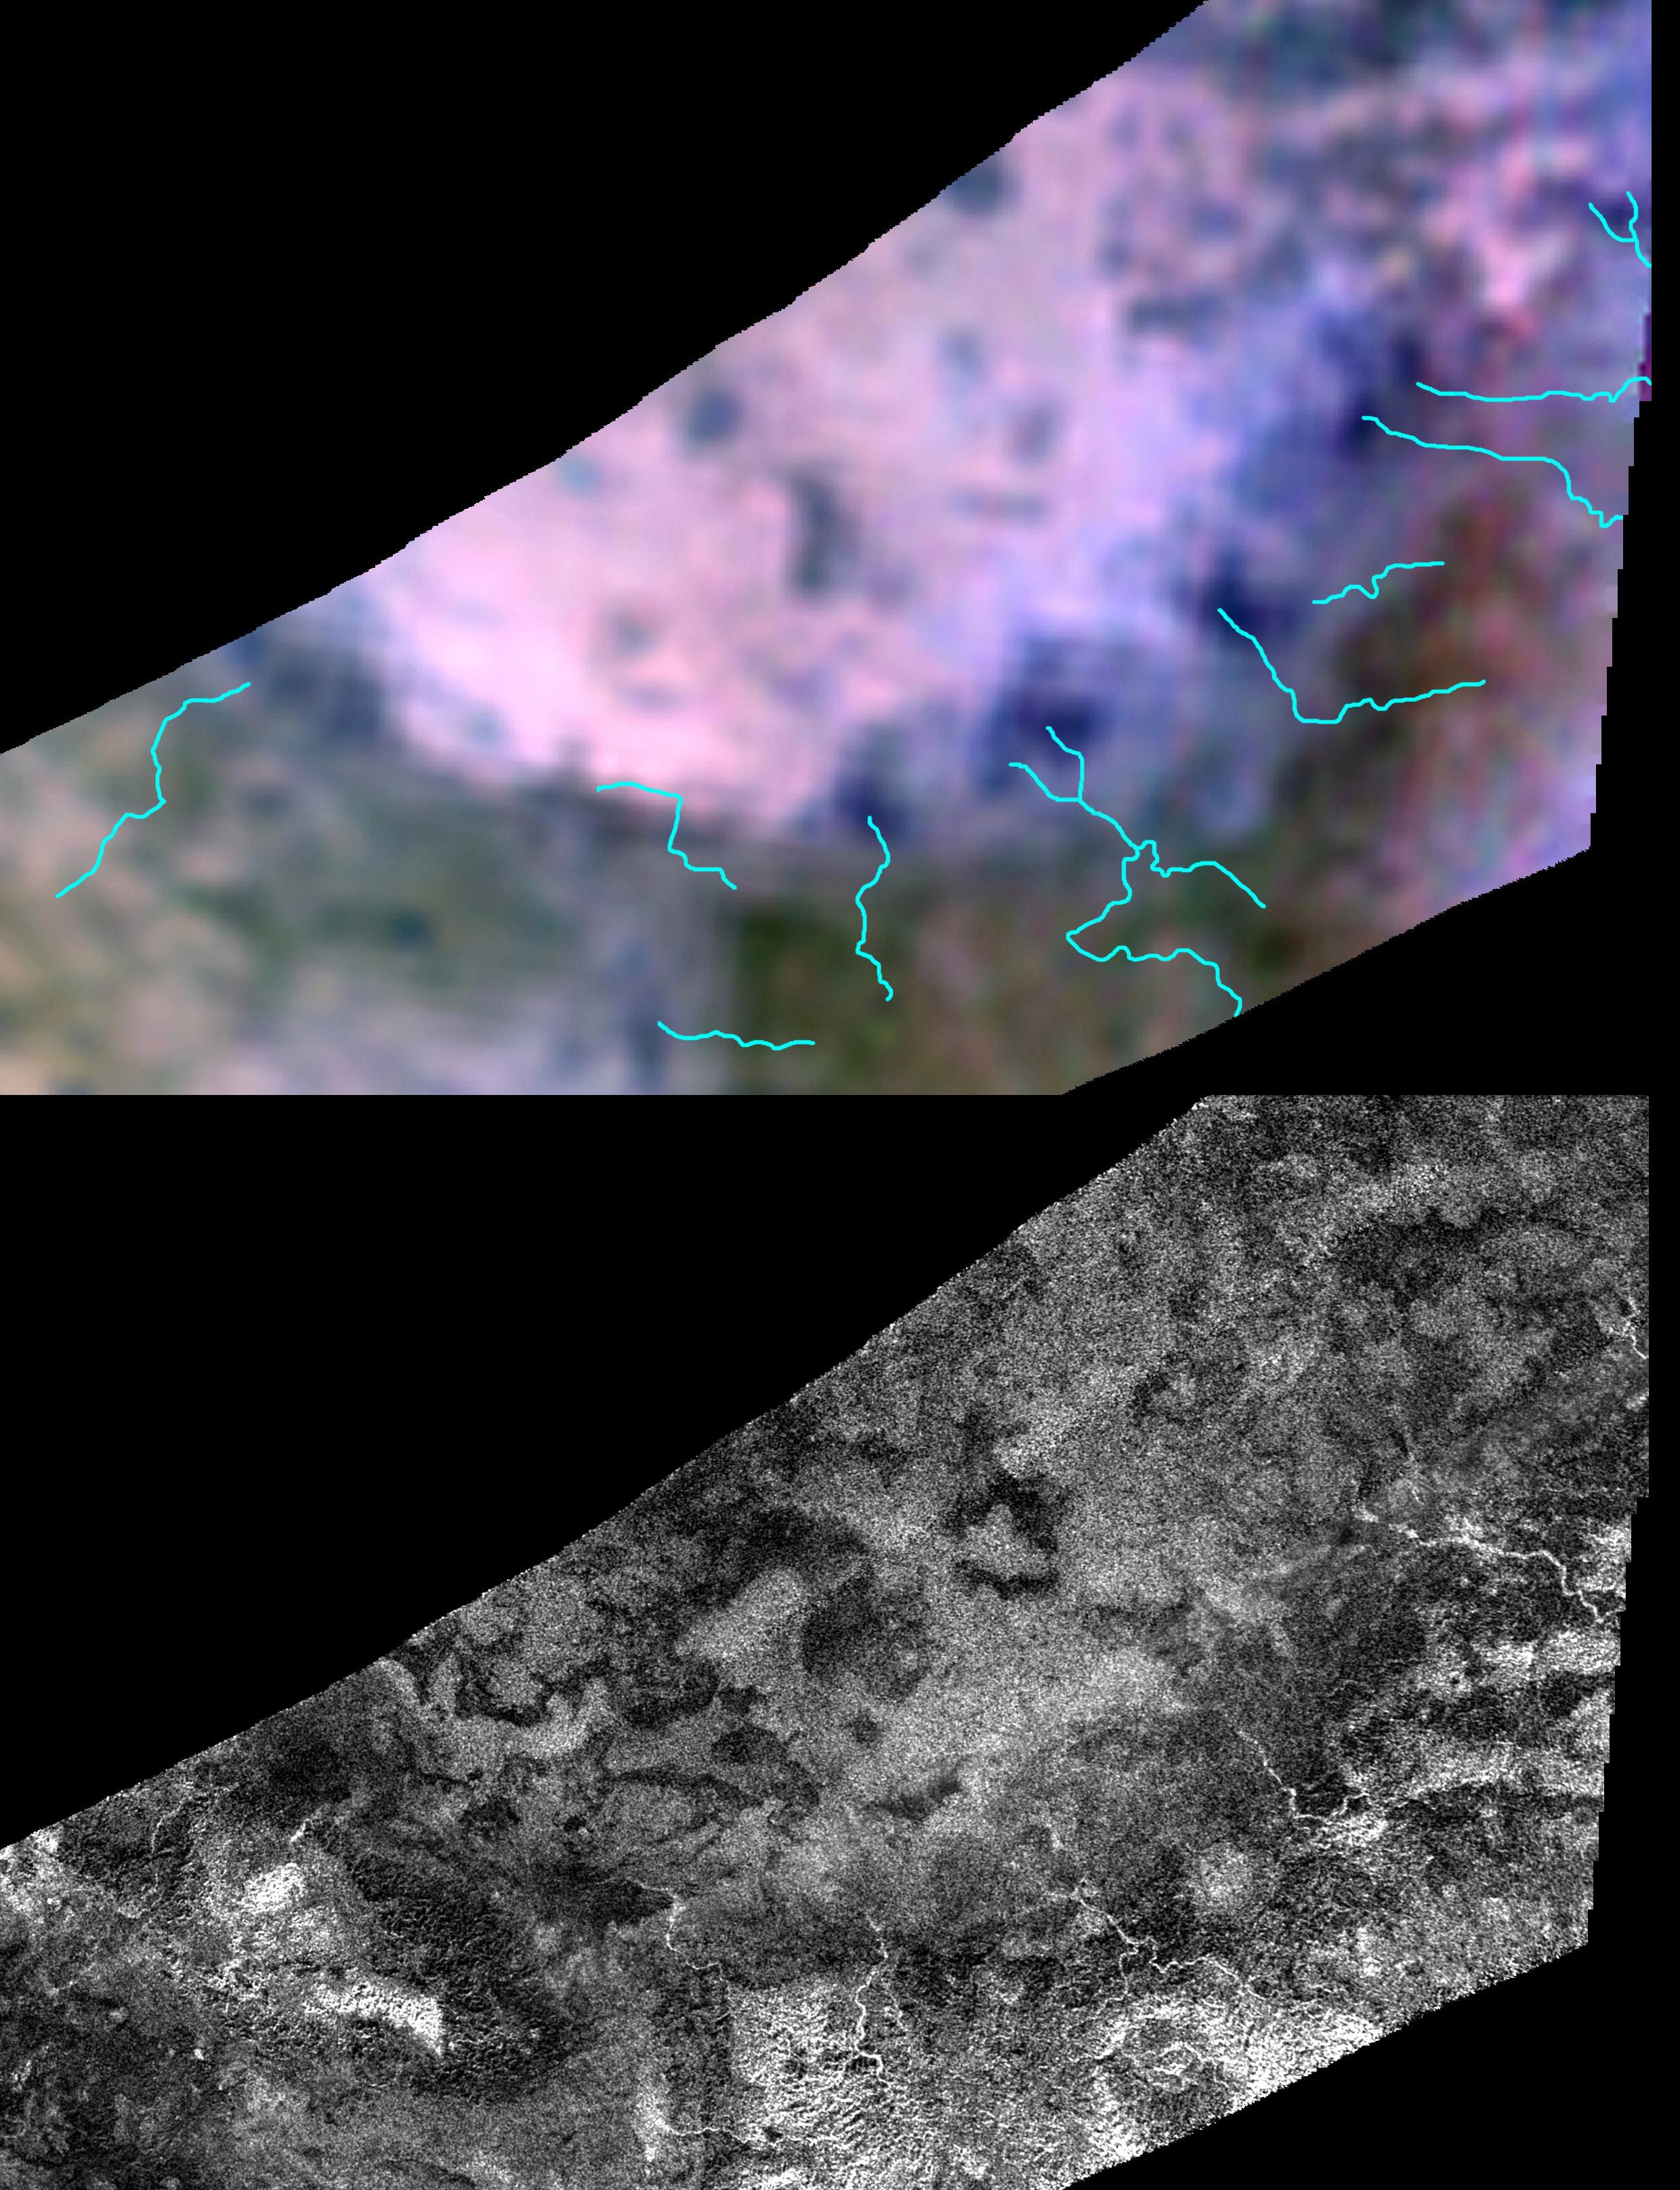
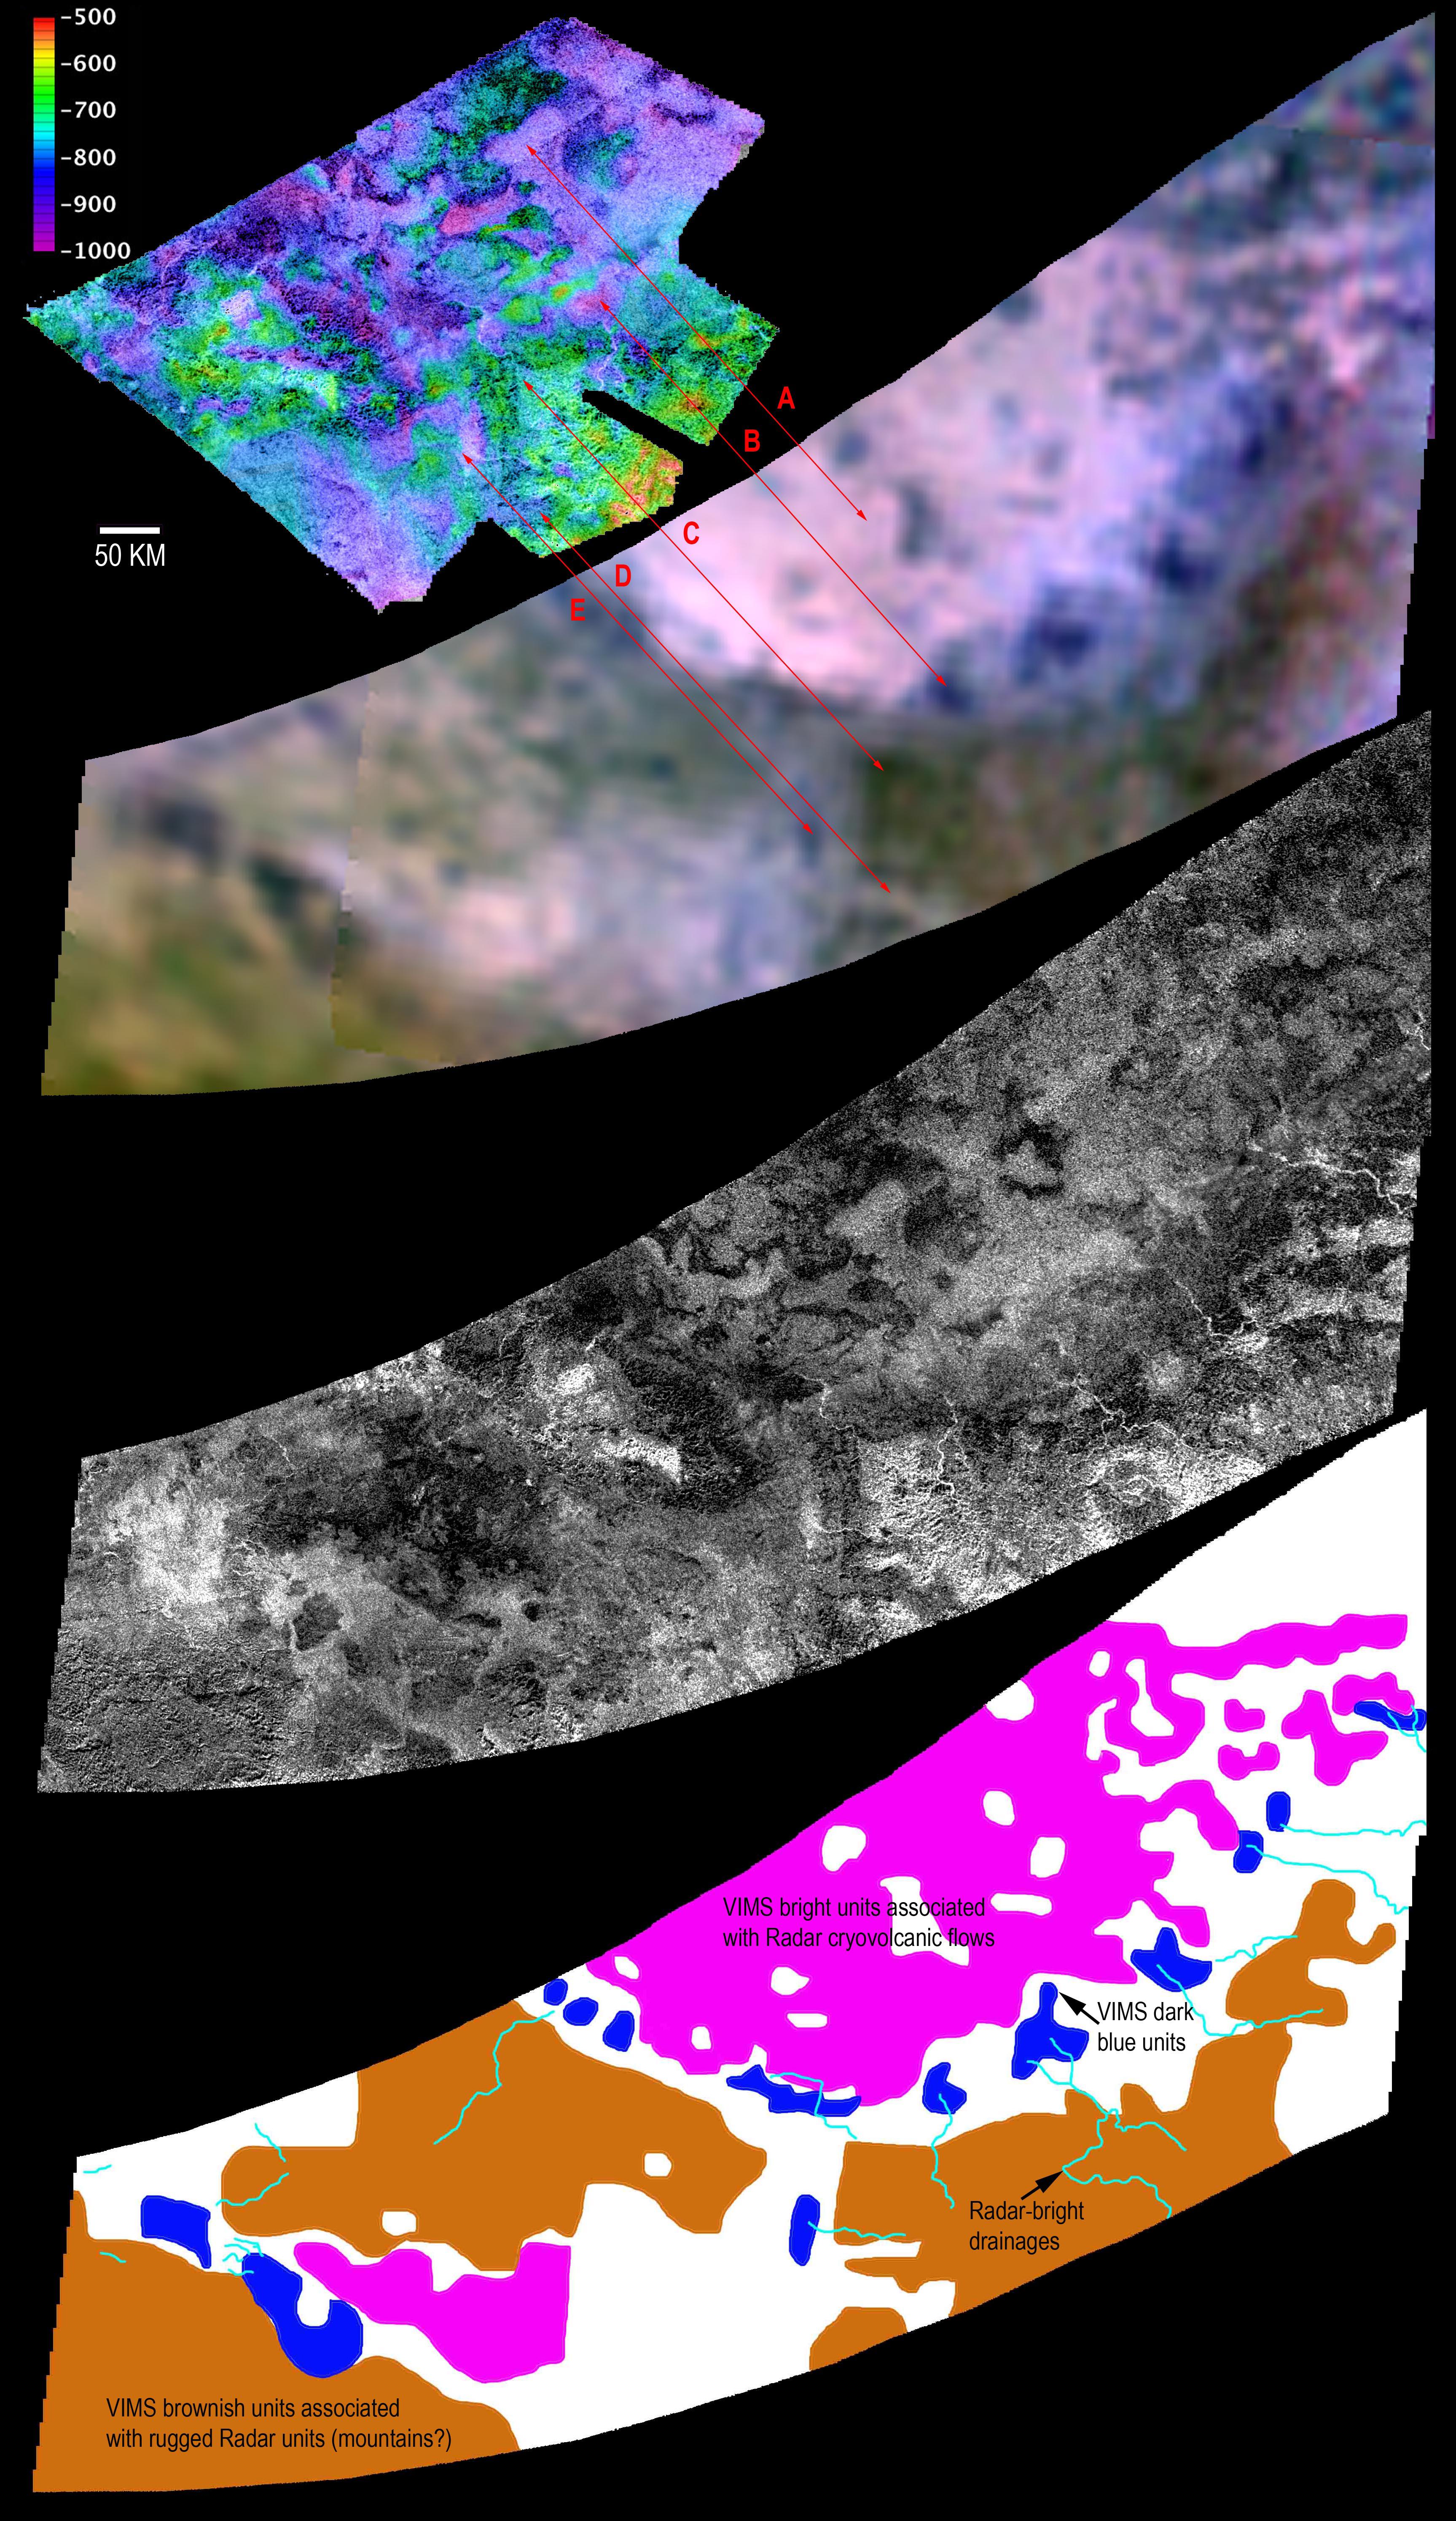
The images above reveal Sotra Facula, an optically bright area of Titan believed to correspond to a cryovolcanic feature. The view of the globe of Titan which incorporates infrared or near-infrared data as well as radar data shows the location of the bright Sotra Facula in the optical H of Fensal/Aztlan. Sotra Facula is indicated by the white arrow. Multiple radar swaths acquired by the radar mapper of the Cassini probe are incorporated into the map of the globe. The radar data sweep the area of Sotra Facula. The infrared or near-infrared data obtained by the Visual and Infrared Mapping Spectrometer (VIMS) cover the rest of the globe. Sotra Facula is located around 15 degrees south latitude, 40 degrees west longitude. The irregular topography and the optical appearance of Sotra Facula suggest that it may be a cryovolcano or an ice volcano.
The overlap of several radar swaths of Sotra Facula enabled scientists to obtain 3D views or stereographic images of the area. The lower image is part of an aerial 3D simulation with a flying moving camera revealing the Sotra Facula region. The mountainous region notably unveils two peaks more than 1,000 meters or 3,000 feet tall as well as multiple craters as deep as 1,500 meters or 5,000 feet. Linear Flows emanating from the hills or mountainous features can also be identified. Those flows are strong hints for the cryovolcanism hypothesis.
In the 3D simulation, the topography has been vertically exaggerated by a factor of 10. The dune fields tend to be represented by brown-blue colors in the simulated image. The blue color suggests the presence of some exposed ice. The specialists believe that the bright areas have an organic coating blanketing the ice and that they are different and lighter than the dunes. The dunes tend to appear in flat and low-altitude areas. Yellow and white areas in the simulated image appear as high-altitude features. The finger-like flows may be relatively thin, maybe less than approximately 100 meters or 300 feet thick.
Sotra Facula is not the only candidate for cryovolcanism on Titan. One can also mention the bright Hotei Arcus. The deep crater of Sotra Facula may be an impact crater or a caldera. If we say caldera, that implies the past or current presence of a hot spot in the area. In other words, the crater may correspond to a collapsed volcanic dome. Scientists will have to precisely determine the nature of the flows emanating from Sotra Facula. Is the material made of water ice, ammonia ice, frozen carbon dioxide, hydrocarbons, methane, ethane, propane, acetylene, ethylene or benzene?

Image Credit (top view): NASA/JPL-Caltech/University of Arizona
Image Credit (lower view): NASA/JPL-Caltech/USGS/University of Arizona


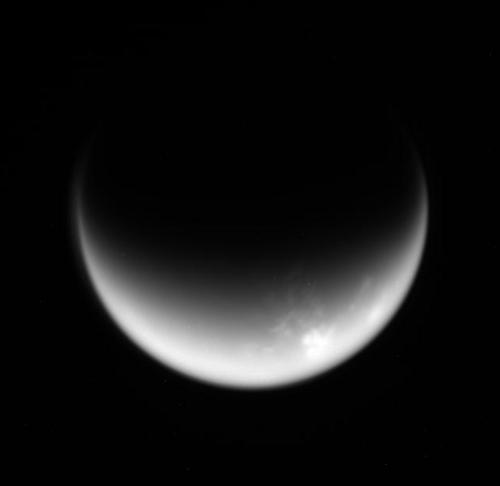
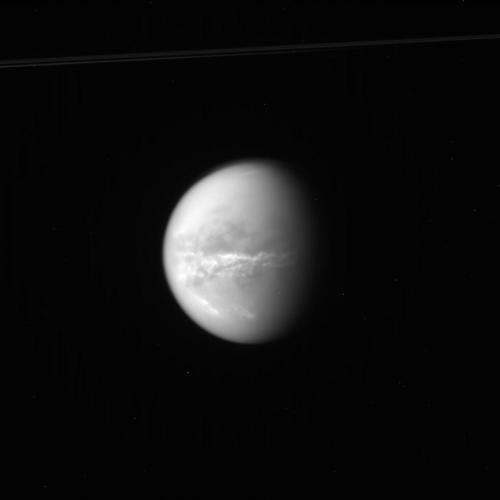
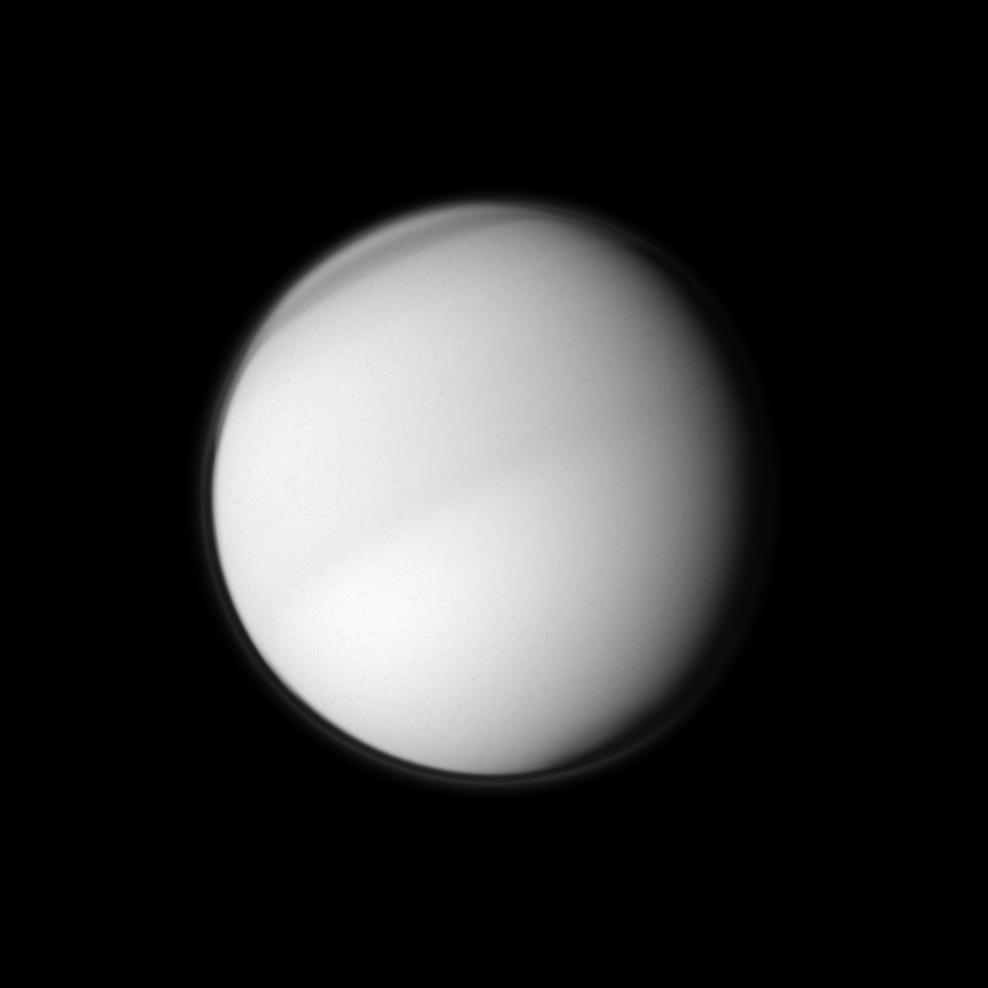
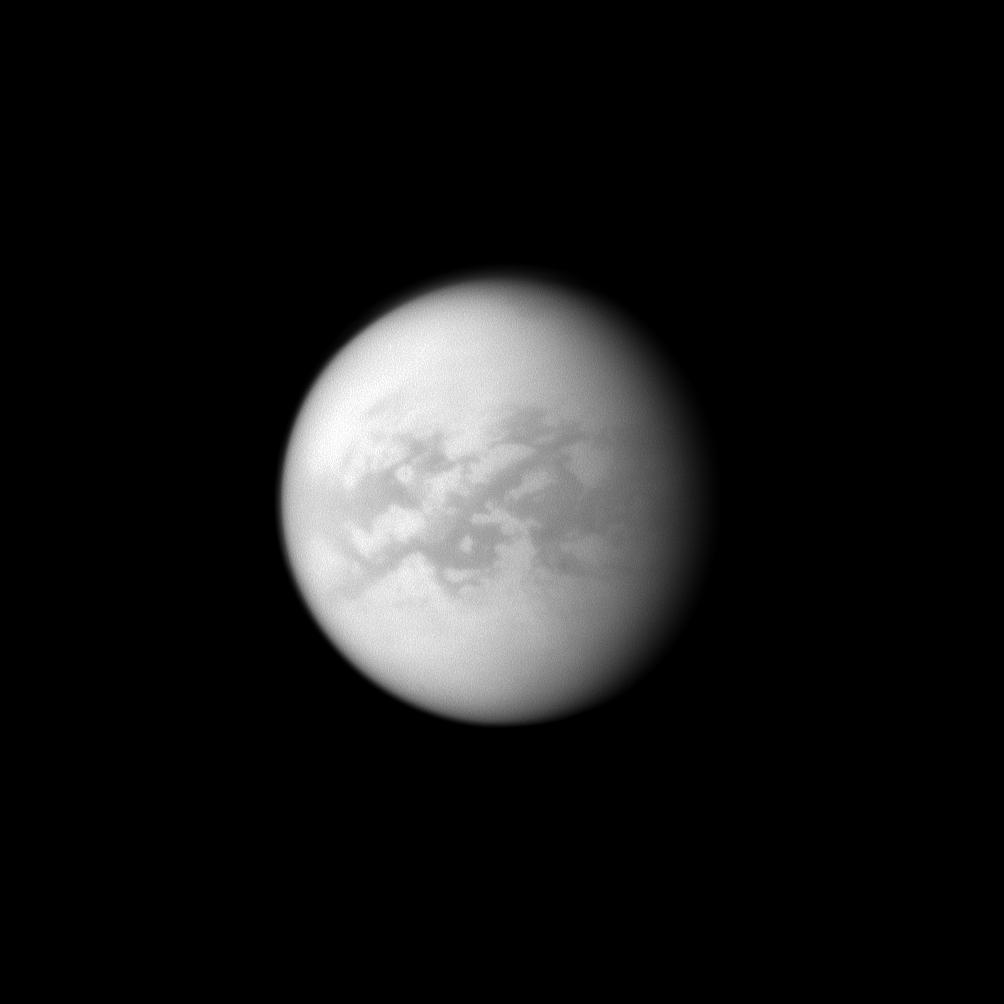
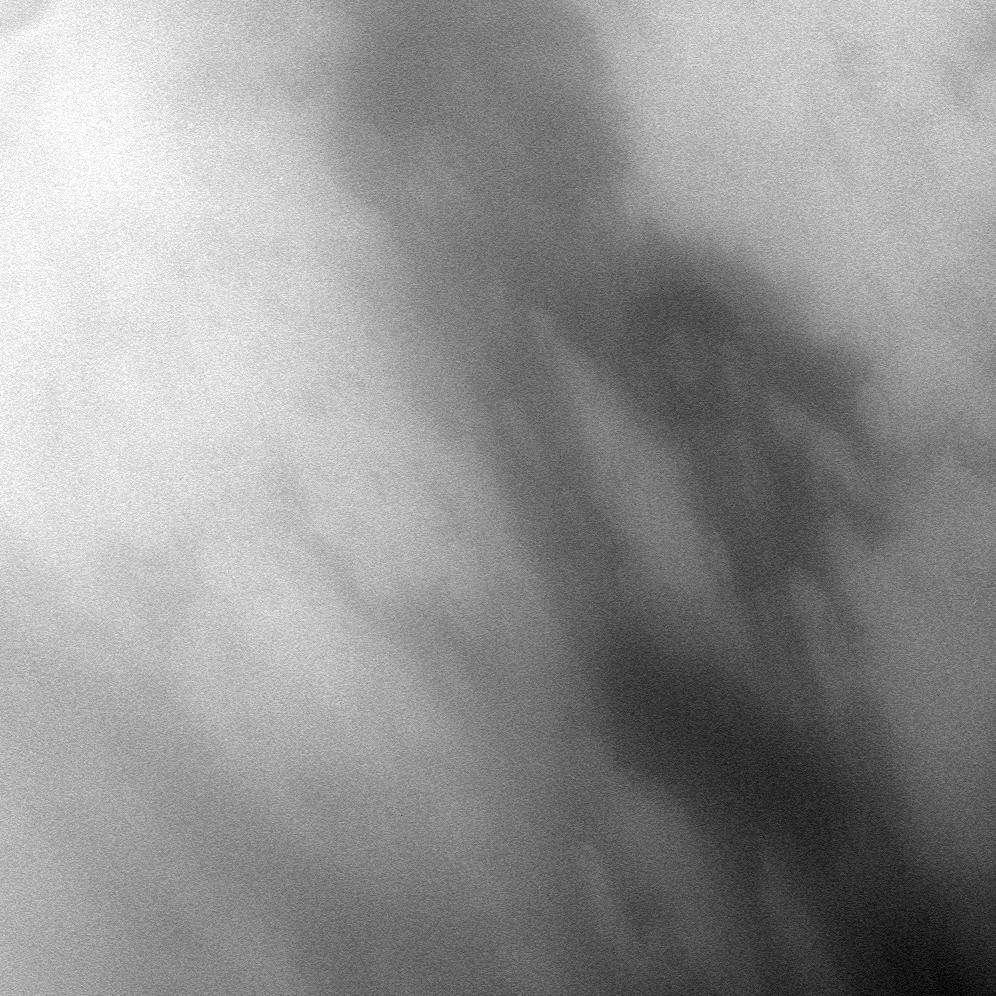
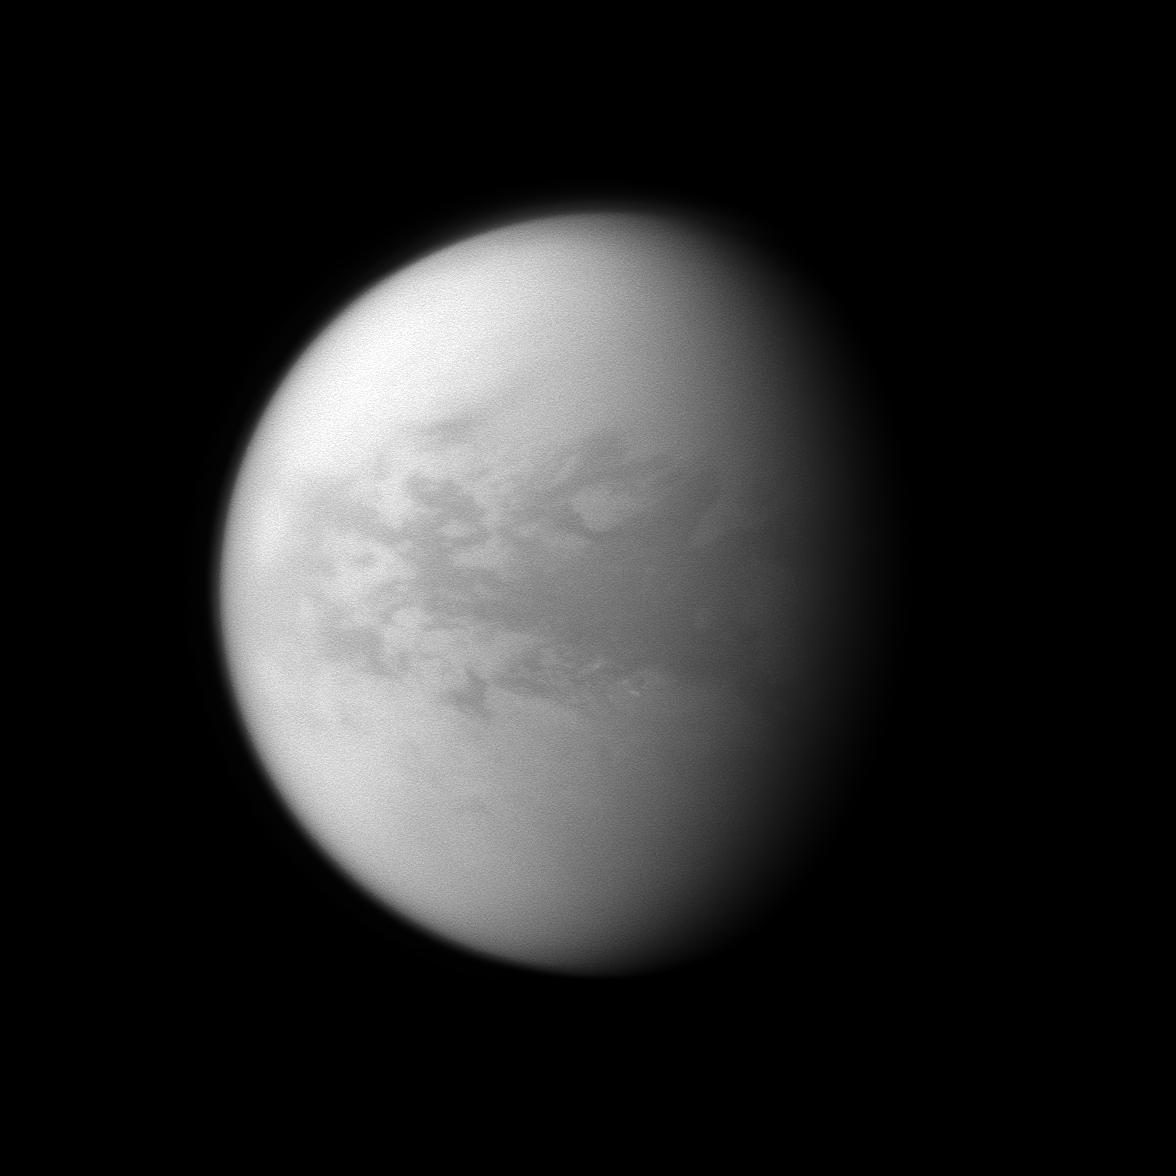
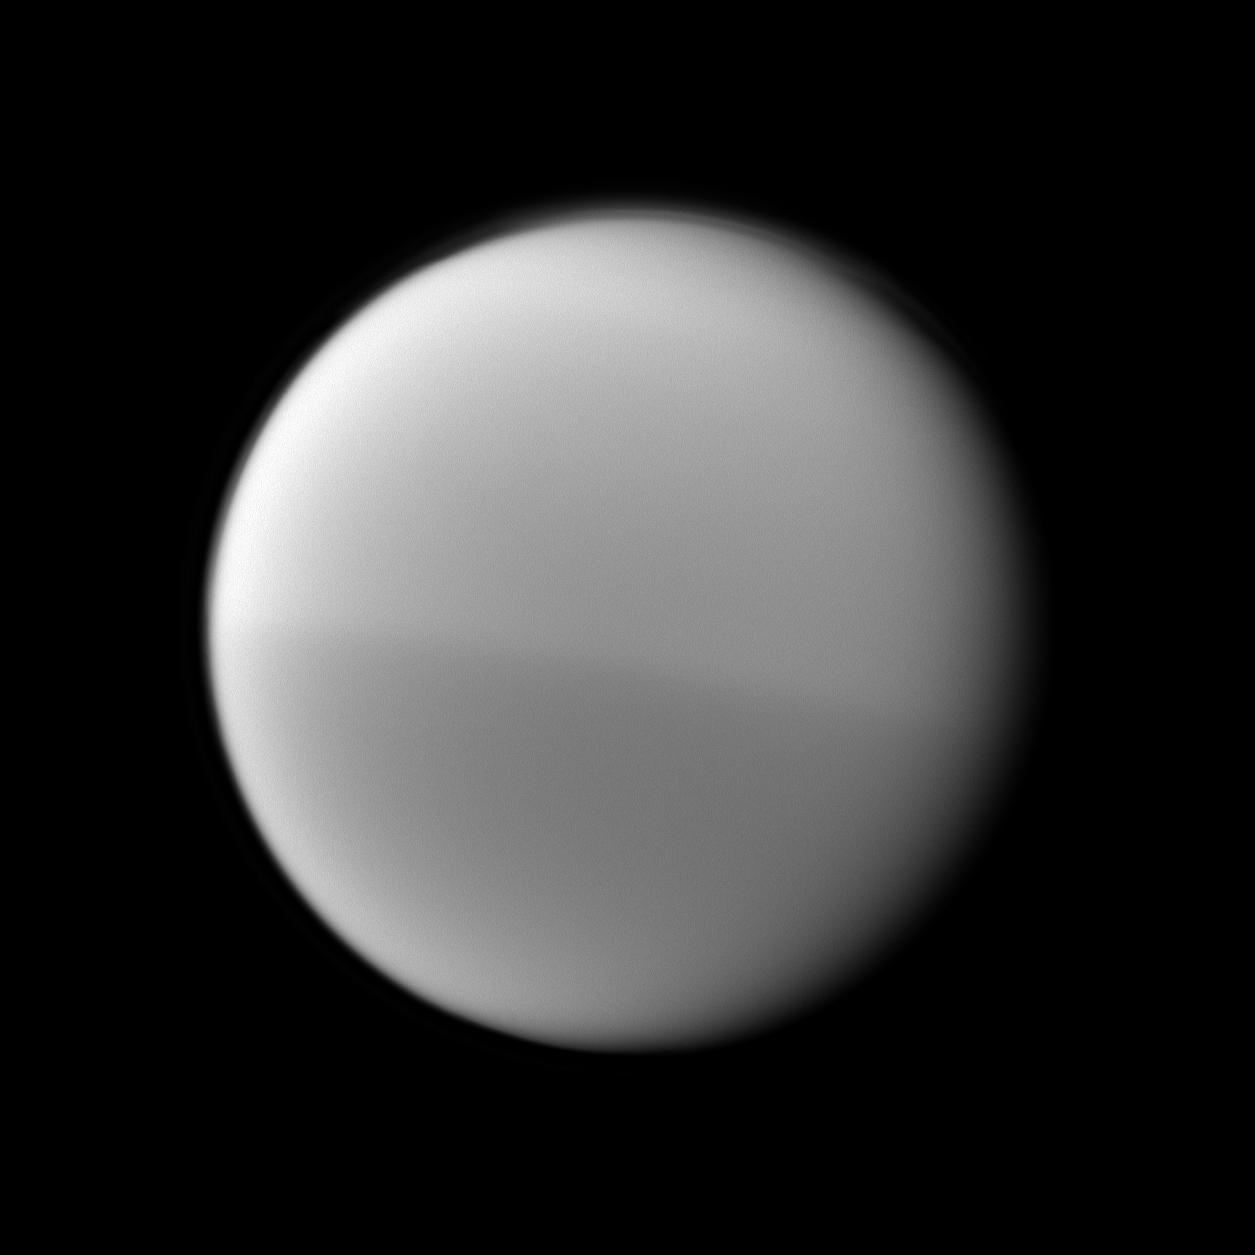
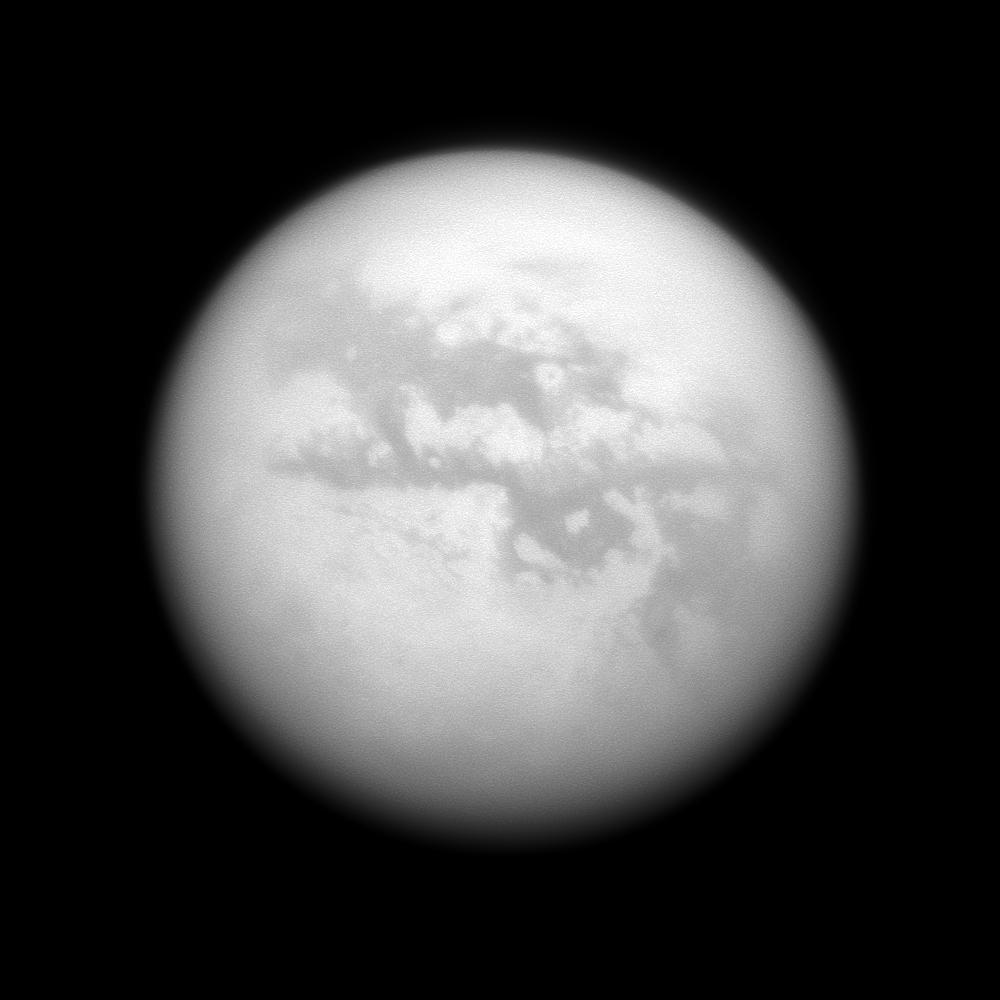
The three views above were obtained by the Cassini spacecraft between October 14, 2010 and October 18, 2010. The top view which corresponds to a raw image of Saturn's largest moon Titan was captured on October 14, 2010. The camera was pointing toward the Opaque Moon at about 207,643 kilometers (129,023 miles) away. The shot has not been validated or calibrated. One can notice a large amount of cloud formations scattered, in the lower part, in the illuminated portion of the disk.
The middle view also corresponds to a raw image of Titan, acquired by the Cassini probe on October 18, 2010. The imaging camera of the spacecraft was approximately 2.5 million kilometers (1.5 million miles) away from the Orange Moon. The view has not been validated or calibrated. The faint, dark rings of the Gas Giant Saturn can be identified in the upper part of the image. The most striking feature in that view is the presence of a large amount of elongated cloud formations in the low latitudes, within the Tropics, in the Fensal/Aztlan area.
The equatorial clouds may reveal a major meteorological consequence of the change in seasons. Spring has been progressing in the northern hemisphere since August 2009. The southern hemisphere is now in the Autumn season and each season lasts about 7 years. Rains of hydrocarbons may start to appear where the Huygens probe landed on January 14, 2005 in the area of Shangri-La and Adiri in the low latitudes of the southern hemisphere.
The lower view unveils the Opaque Moon and Tethys in the foreground. The image corresponds to a raw image acquired by the Cassini probe on October 18, 2010. Titan which is moving farther from Saturn than the bright, icy moon Tethys is the only satellite of Saturn to be covered with an atmosphere. In the upper part of the image, one can notice the faint, dark rings of Saturn. The view has not been validated or calibrated.

Image Credit: NASA/JPL/Space Science Institute


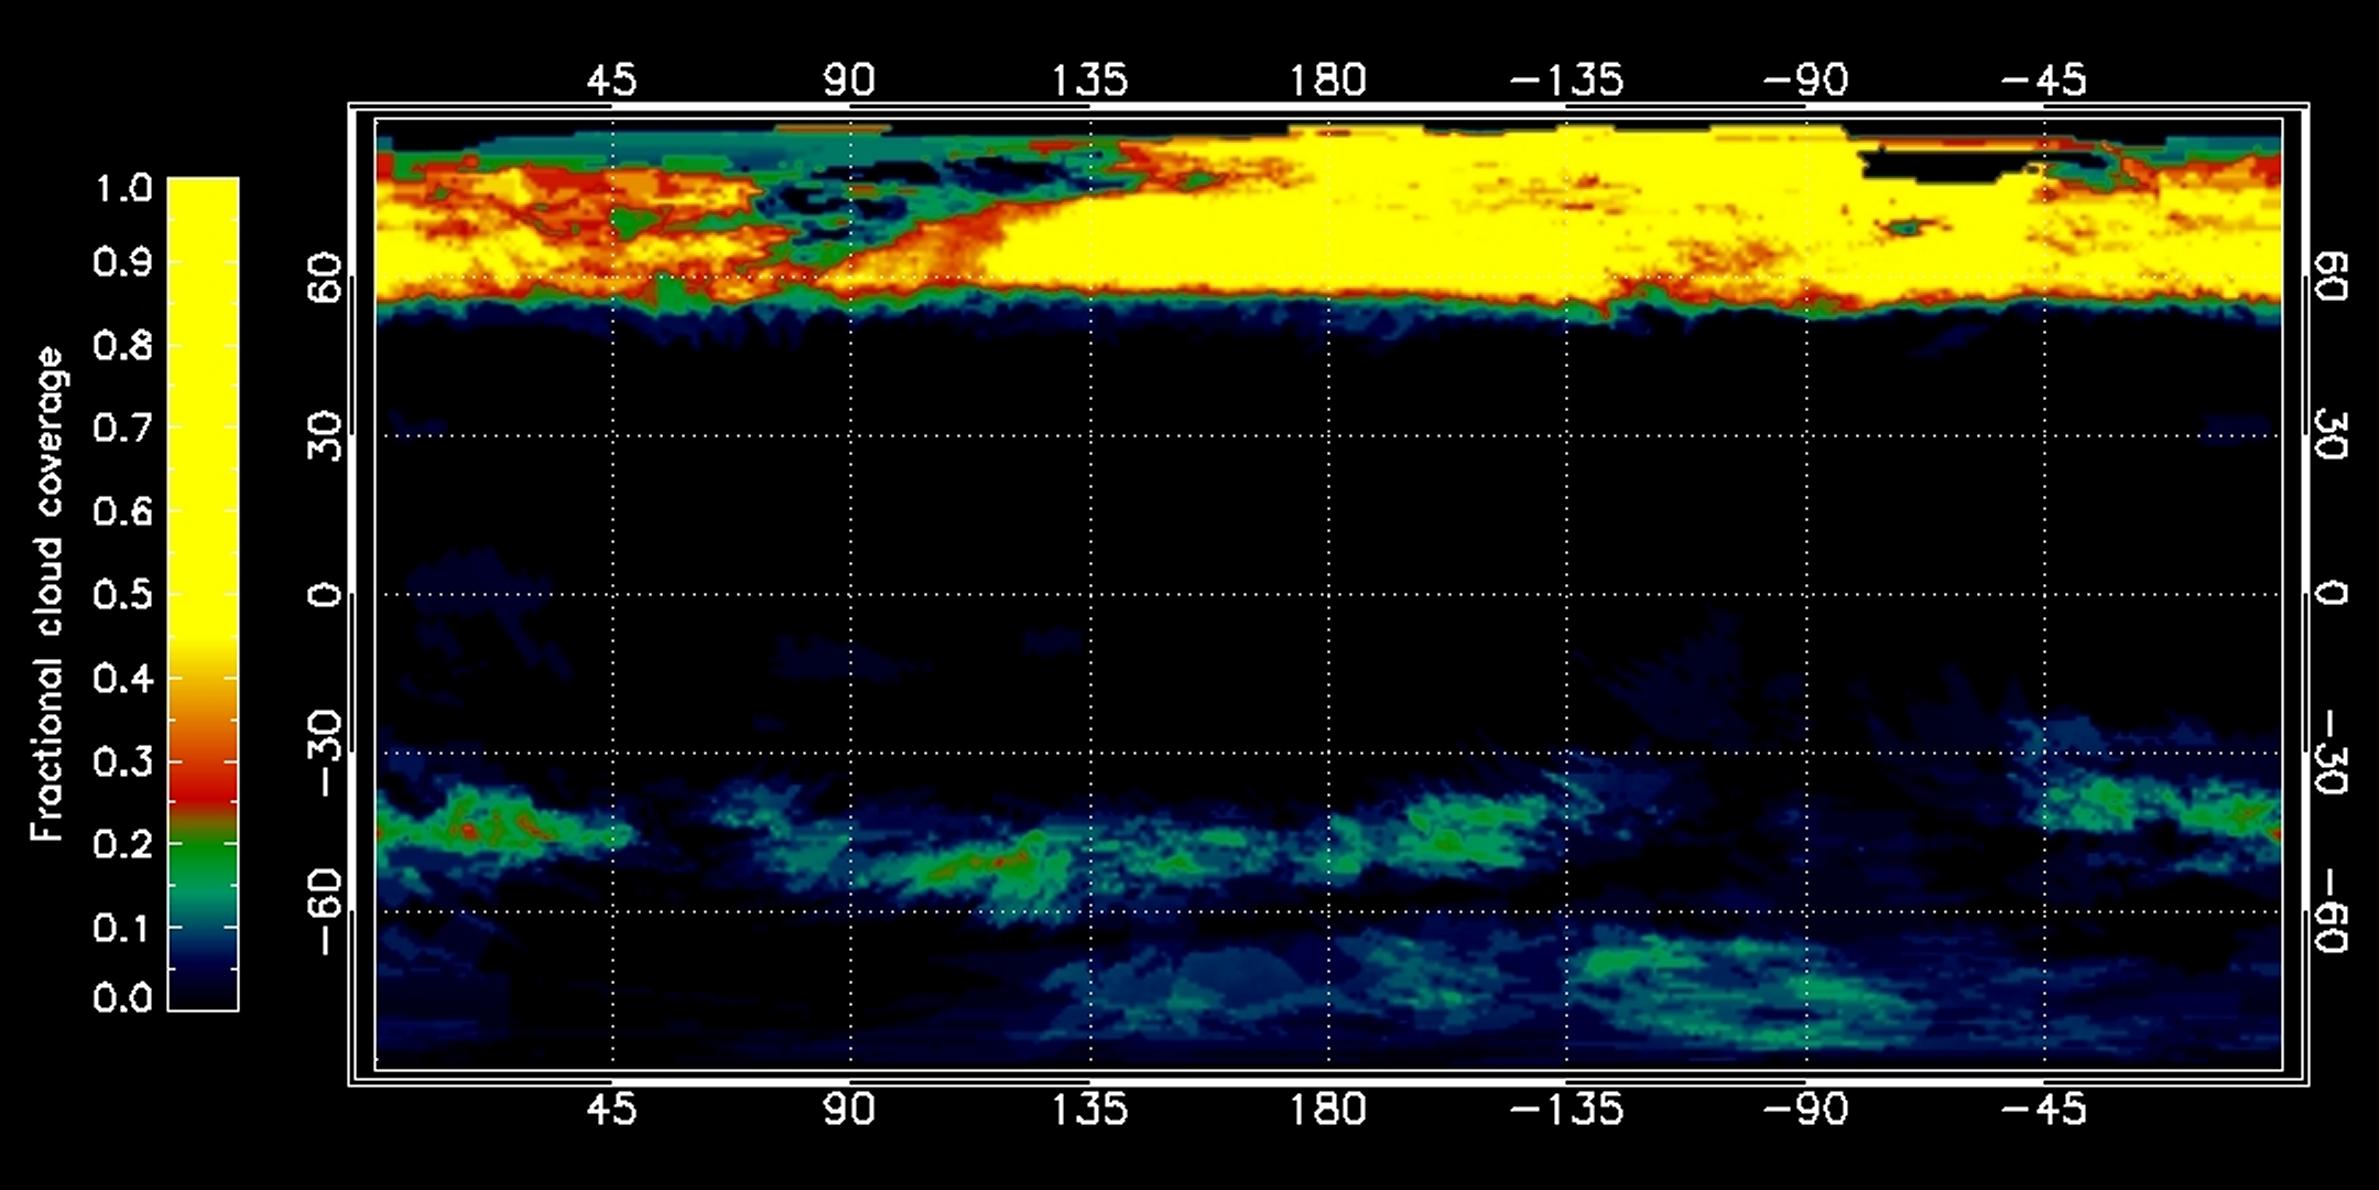
This graphic based on data obtained by the Visual and Infrared Mapping Spectrometer of the Cassini spacecraft reveals the distribution and the percentage of cloud coverage on the globe of Saturn's largest moon Titan. Latitudes and longitudes are represented along the margins of the map and different colors are used to indicate the percentage of cloud coverage. The color scale on the left of the graphic links the fractional cloud coverage to particular colors. The yellow represents the highest cloud coverage. The maximum is associated with a complete cloud coverage. The black color is on the other extreme of the color scale, representing the minimum cloud coverage or no cloud coverage. The graphic is the outcome of a survey ranging from July 2004 to April 2010.
The graphic shows a high concentration of clouds in the north polar region, clouds in the south polar region as well as clouds along a narrow band at about 40 degrees south latitude. It turns out that the development of clouds as well as the dynamics of clouds are closely related to seasons. The northern hemisphere has experienced the winter season for about 7 years until the equinox that occured in August 2009, when the Sun shone directly over the equator. By contrast, the southern hemisphere experienced the summer season while the northern hemisphere was in the winter season. Apparently, the orbital configuration and these seasons have strong implications for the distribution of clouds on the Orange Moon.
During northern winter, the north polar region was covered with a high concentration of ethane clouds. A giant ethane cloud resembling a vortex or a hurricane engulfed the north polar region. Ethane clouds took shape in the troposphere, from a constant influx of ethane (C2H6) and aerosols from the stratosphere which corresponds to the gas layer above the troposphere. By contrast, in the southern hemisphere, atmospheric compounds enriched with methane (CH4) welled up from the soil to generate mid- and high latitude clouds.
During the summer season in the southern hemisphere, several transient, elongated clouds have been spotted in the mid-latitudes of the southern hemisphere and dynamic cloud outbursts have been observed in the south polar region. The southern hemisphere is now experiencing the autumn season while the northern hemisphere is experiencing the spring season. Scientists expect significant changes in the distribution of clouds. The clouds of the north polar region will likely get thinner or dissipate as the summer season approaches. On the other hand, the south polar clouds may grow as the winter season approaches. Elongated and transient clouds may start to appear in the mid-latitudes of the northern hemisphere and the transient and elongated clouds of the mid-latitudes of the southern hemisphere may progressively disappear due to seasonal effects and the orbital configuration.

Image Credit: NASA/JPL/University of Arizona/University of Nantes/University of Paris Diderot


This mosaic of false-color images of Titan's globe reveals changes in cloud coverage over the north polar region and developments of cloud formations at mid-latitudes in the southern hemisphere of Saturn's largest moon.
The cloud formations appear yellow in this image and the hazy atmosphere is shown in magenta. The left view of the Orange Moon which is based on a May 12, 2008 image unveils clouds clearing in the north polar region. The right view of the globe which is based on a December 12, 2009 image unveils clouds appearing around 40 degrees south latitude.
The development of cloud systems is thought to be closely linked to seasons and the orbital configuration of the hazy moon to the Sun. The curved clouds of the left view were imaged at the end of the winter season in the northern hemisphere. The equinox, when the Sun shone directly over the equator, occured in August 2009, marking the end of the summer season in the southern hemisphere and the winter season in the northern hemisphere.
The left view suggests that the cloud cover is diminishing in the north polar region. The right view of the moon clearly shows active, patchy clouds in a region supposed to be relatively dry at the beginning of the autumn season in the southern hemisphere.
Since its arrival at Titan and the Saturn System in 2004, the Cassini spacecraft has revealed a complex meteorology on the Opaque Moon with cloud formations developing in particular zones or areas. A giant ethane cloud engulfing the north polar region and resembling a huge hurricane was identified. A system of dynamic and dissipating clouds was observed in the region of Ontario Lacus in the south polar region during the summer season, as well. Cirrus clouds or elongated clouds were observed at mid-latitudes in a narrow belt around 40 degrees south latitude.
The observation of clouds and their distribution are consistent with the models simulating the mechanisms in Titan's atmosphere. Scientists are starting to decipher the formation, the dynamics, the movement or the mechanics of cloud systems on Titan. The seasons seem to play a key role in the formation, disappearance and circulation of cloud formations. Clouds at the south polar region disappeared just before equinox and the clouds in the north polar region are thinning out. A shift in cloud activity between the south pole and the north pole is expected with the summer season approaching in the north polar region.
The northern polar clouds of ethane identified during the winter season developed in the troposphere from a constant influx of ethane and aerosols from the stratosphere. Let's mention that the stratosphere appears above the troposphere. By contrast, the atmospheric gases enriched with methane appearing in the southern hemisphere welled up from the surface to generate mid- and high-latitude clouds.
The artificial views of the globe were based on data from the Visual and Infrared Mapping Spectrometer acquired in the near-infrared wavelengths. Scientists selected particular wavelengths of infrared radiation to identify clouds, assigning them red, green and blue channels. The radiations in the 2 micron wavelength which are colored red reveal the surface features. The radiations in the 2.11 micron wavelength which are colored green reveal the troposphere or the lowest portion of the atmosphere. The radiations at the 2.21 micron wavelength which are colored blue reveal the hazy stratosphere which glides above the troposphere. The yellow color of the clouds is due to the reflection of the channels colored red and green, the blue channel being completely or partly retained by the clouds.

Image Credit: NASA/JPL/University of Arizona/University of Nantes/University of Paris Diderot


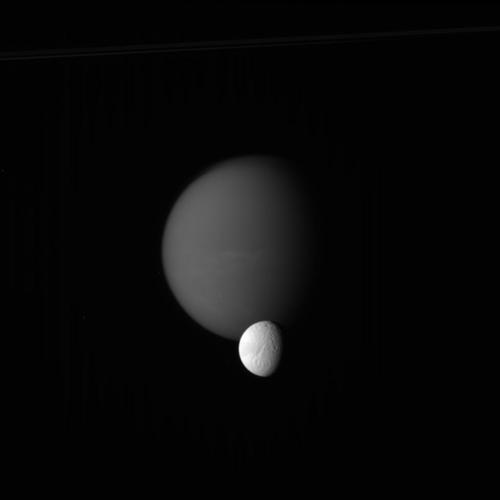
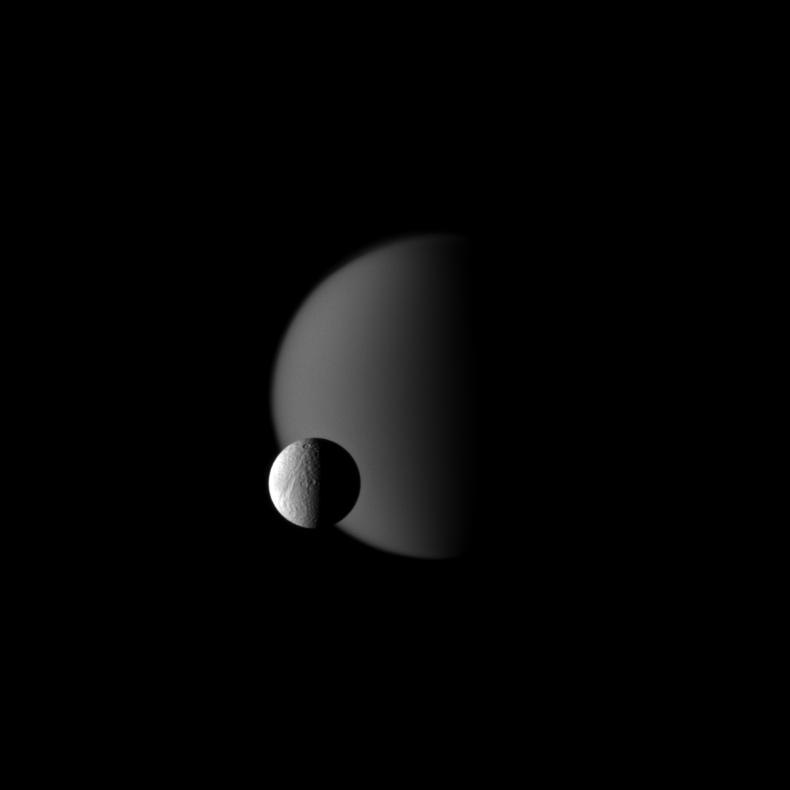
The two largest moons of Saturn, Titan and Rhea, can be observed in this view showing the icy moon Rhea passing in front of the Opaque Moon Titan. Rhea orbits closer to Saturn at a mean distance of about 527,108 km (328,000 miles). Rhea is largely smaller than Titan with a diameter of about 1,528 km (949 miles).
One can clearly notice the cratered terrain of Rhea and the opaque atmosphere of Titan as well as the detached-haze layer in the upper part of the thick atmosphere of the Orange Moon. The illuminated terrain in the image is on the Saturn-facing sides of Titan and Rhea.
The view was acquired in visible blue light with the ISS narrow-angle camera of the Cassini probe on November 19, 2009 at a distance of about 1.1 million kilometers or 684,000 miles from Rhea and 2.3 million kilometers or 1.4 million miles from the Opaque Moon. The image was obtained at a Sun-Rhea-probe, or phase, angle of 118 degrees and at a Sun-Titan-spacecraft, or phase, angle of 118 degrees.

Image Credit: NASA/JPL/Space Science Institute


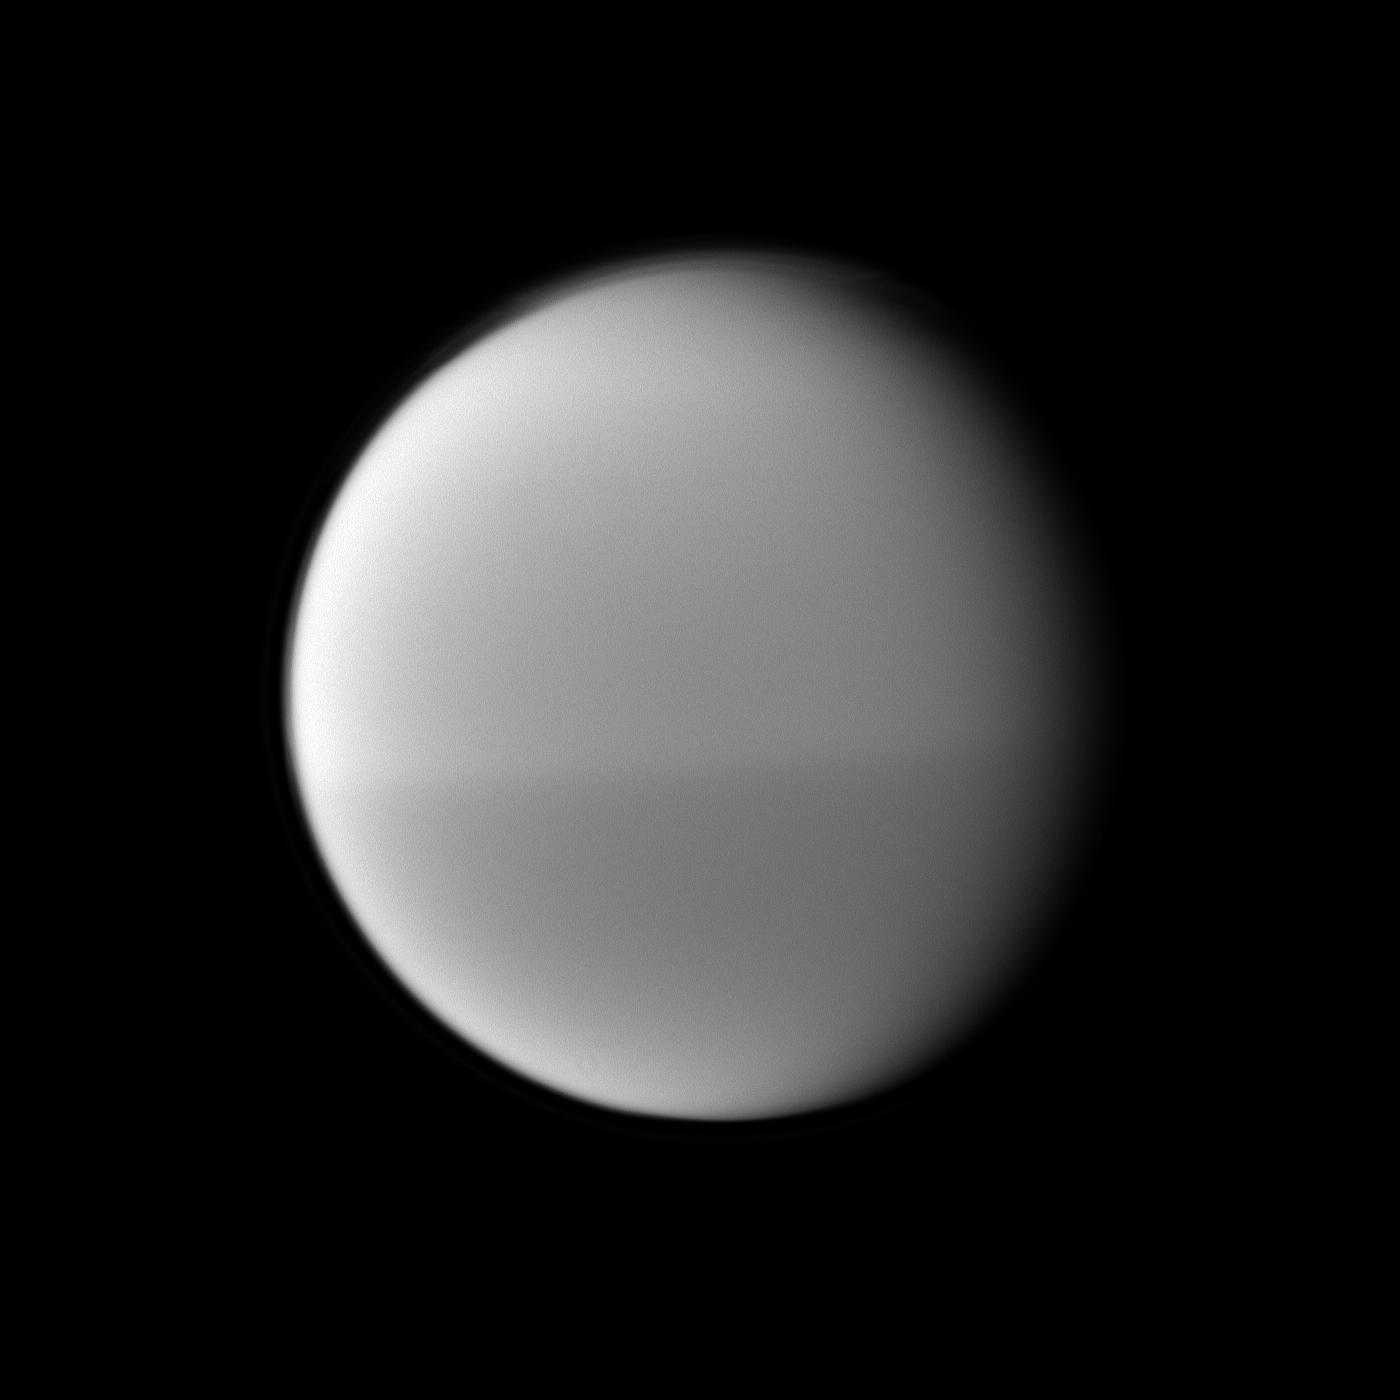
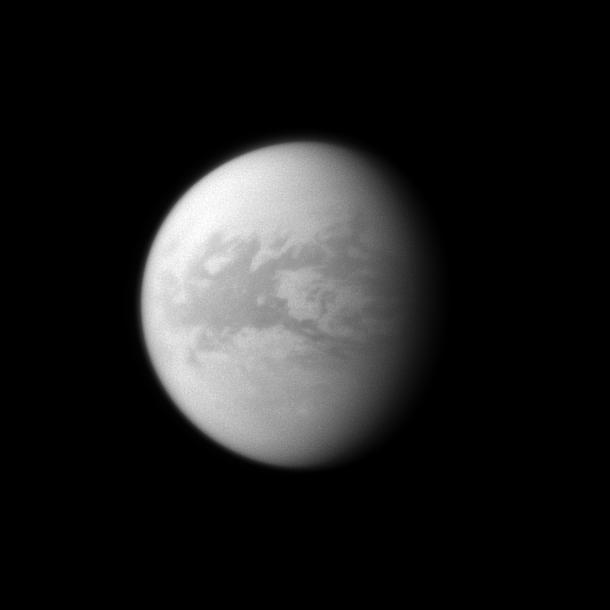
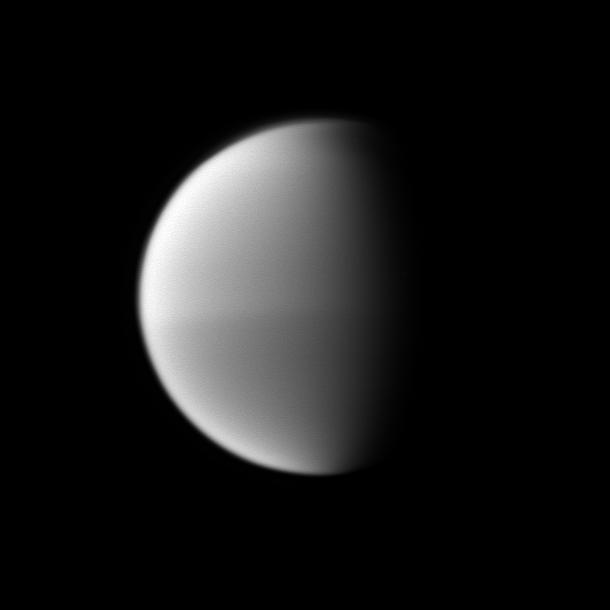
This near-infrared view of Titan's disk unveils the hemispheric dichotomy related to seasonal factors. One can notice that the southern half of the globe appears darker than the northern half. The southern hemisphere is currently in the autumn season while the northern hemisphere is in the spring season. Moreover, one can observe the north polar hood and the detached haze layer in the upper atmosphere of Saturn's largest moon.
The image was obtained with the ISS narrow-angle camera of the Cassini probe on May 22, 2010, using a spectral filter sensitive to wavelengths of near-infrared radiations centered at 889 nanometers. The disk was acquired at a distance of about 1.1 million kilometers or 684,000 miles from the Orange Moon and at a Sun-Titan-spacecraft, or phase, angle of 37 degrees. The camera is orientated toward the leading hemisphere of the Opaque Moon. North is in the upper part of the image and is inclined 2 degrees to the left.

Image Credit: NASA/JPL/Space Science Institute


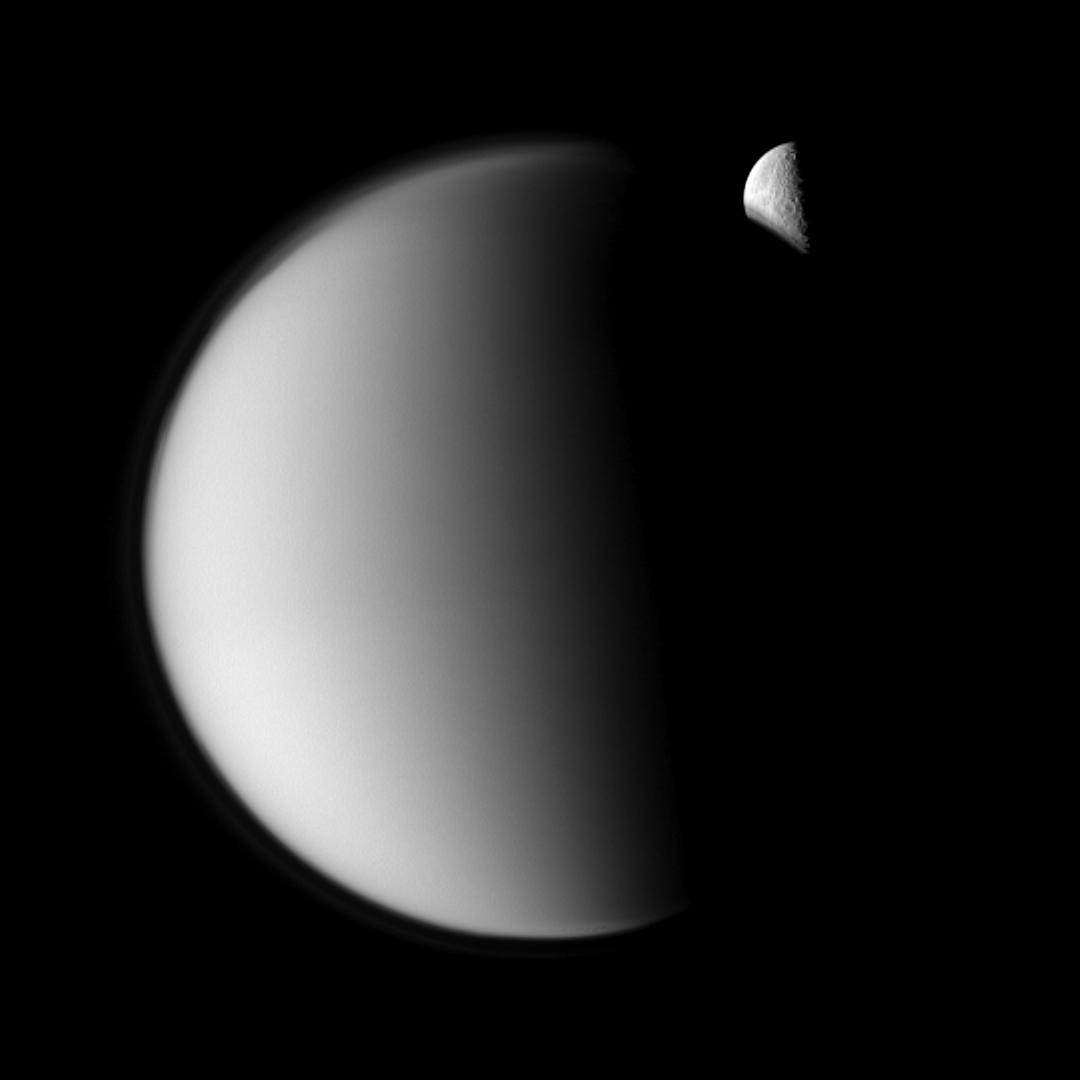
This visible light view reveals Tethys moving in front of Saturn's largest moon Titan. One can clearly see the contrast between the icy moon Tethys or Saturn III and the hazy and opaque moon Titan. The terrain on Tethys has a particularly high albedo due to the presence of large amounts of water ice. The most remarkable features of Tethys are the large crater Odysseus and the giant valley or fracture known as Ithaca Chasma. Ithaca Chasma likely results from extensional phenomena in the crust. The giant impact that created Odysseus may have engendered a shockwave fracturing the crust and generating the rift of Ithaca Chasma.
The image was obtained with the ISS narrow-angle camera of the Cassini probe on October 17, 2009. The view was acquired at a distance of approximately 1.9 million kilometers or 1.2 million miles from Tethys and 2.9 million kilometers or 1.8 million miles from the Orange Moon. Titan is 5,150 kilometers or 3,200 miles in diameter and Tethys is 1,062 kilometers or 660 miles in diameter. The camera is orientated toward the Saturn-facing sides of Tethys and Titan. Tethys orbits Saturn at a mean distance of about 294,619 kilometers (or 183,000 miles) whereas Titan orbits Saturn at a mean distance of approximately 1,221,870 kilometers (or 760,000 miles).

Image Credit: NASA/JPL/Space Science Institute


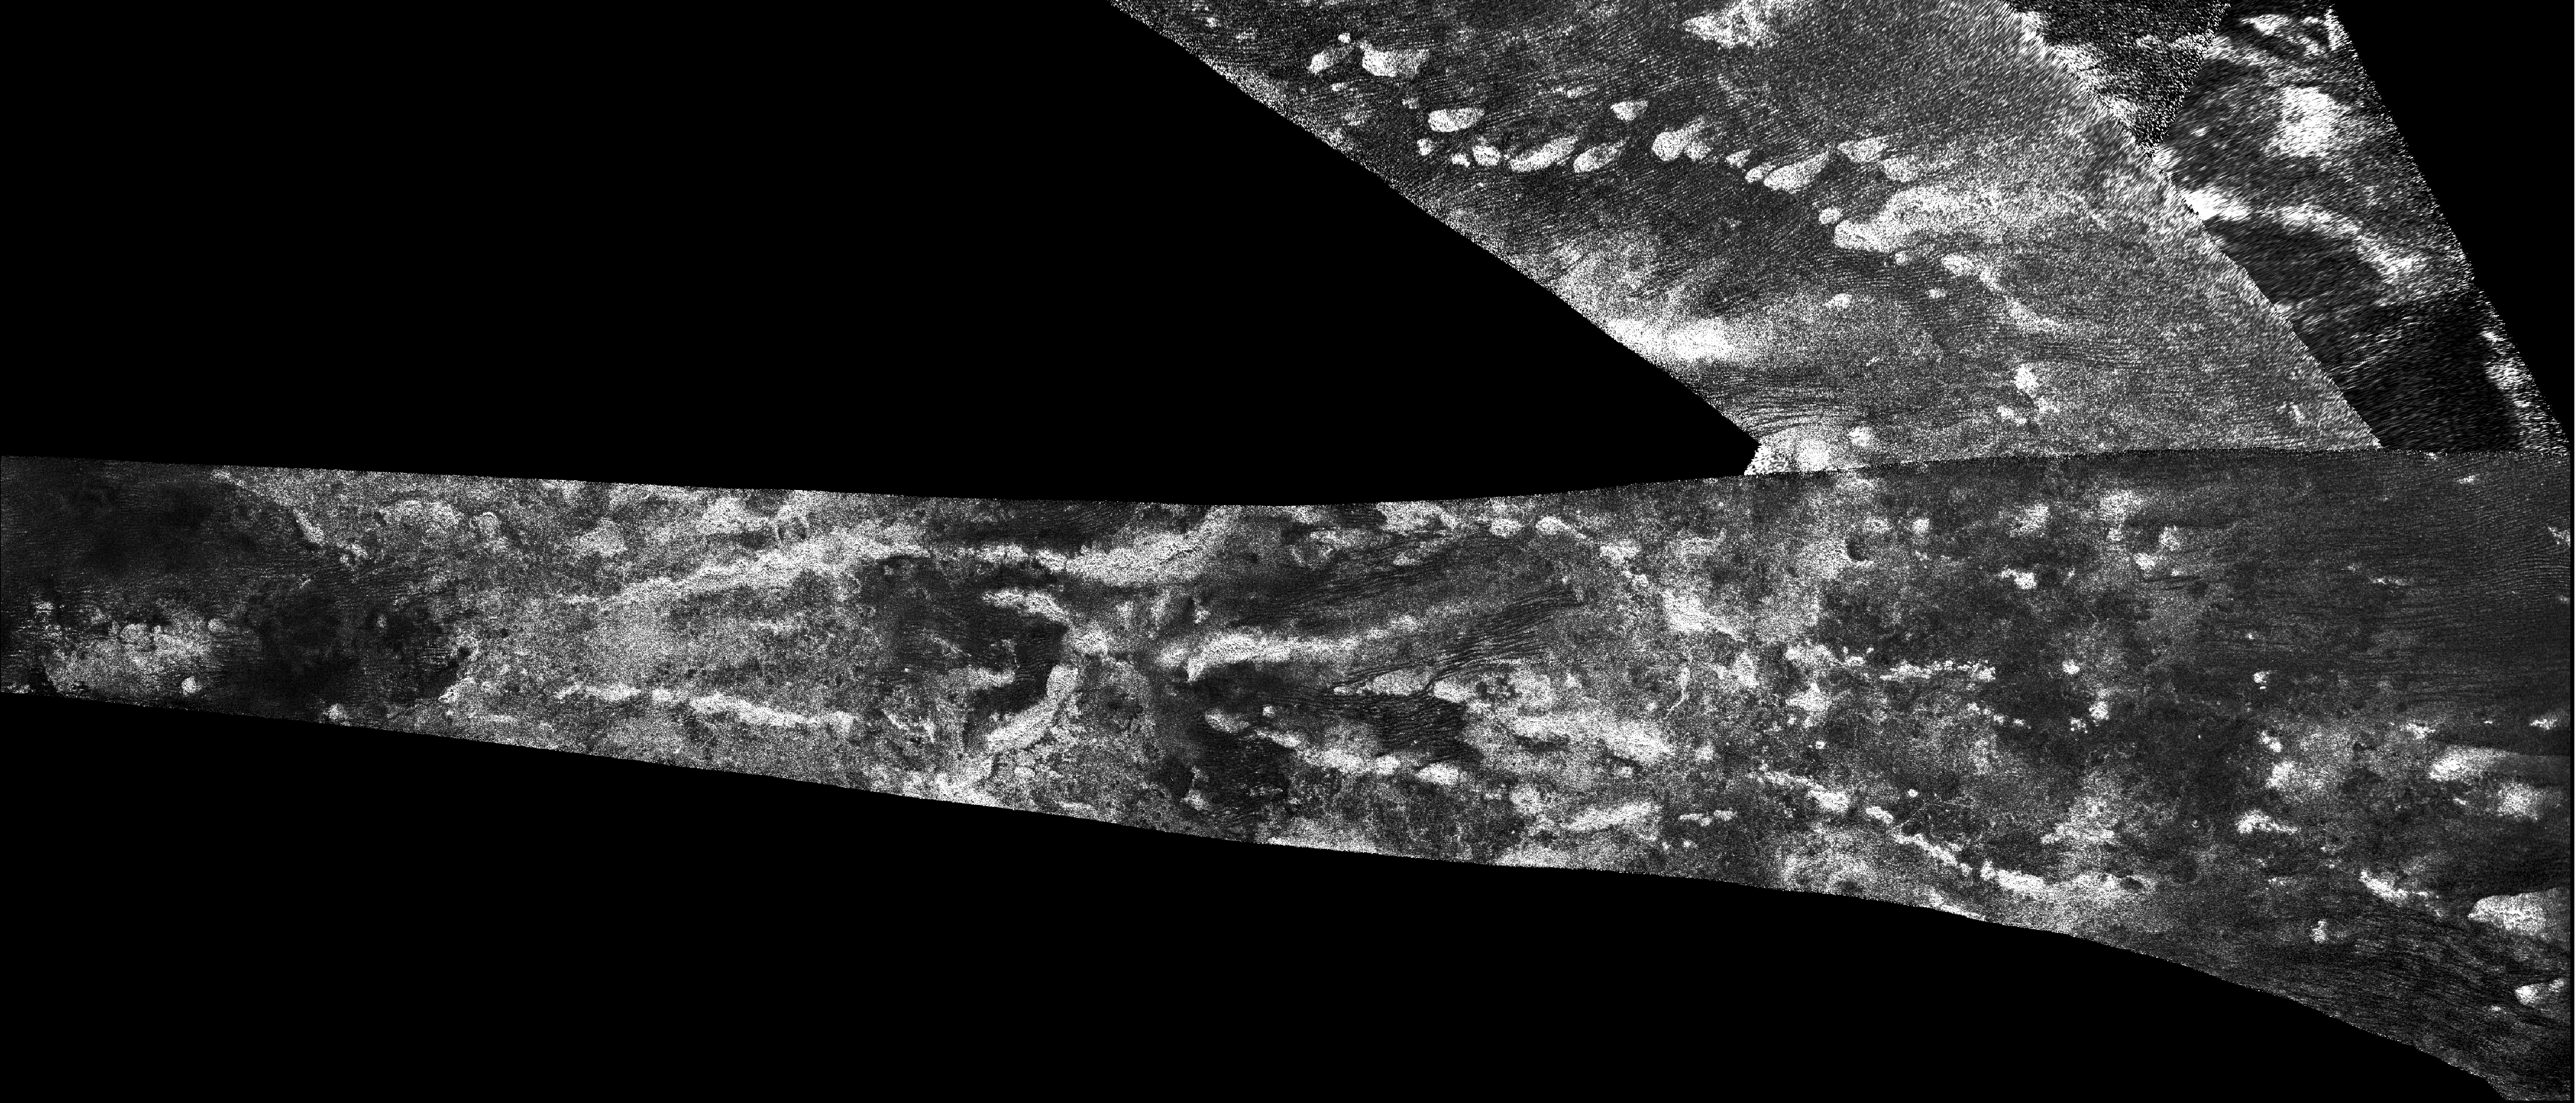
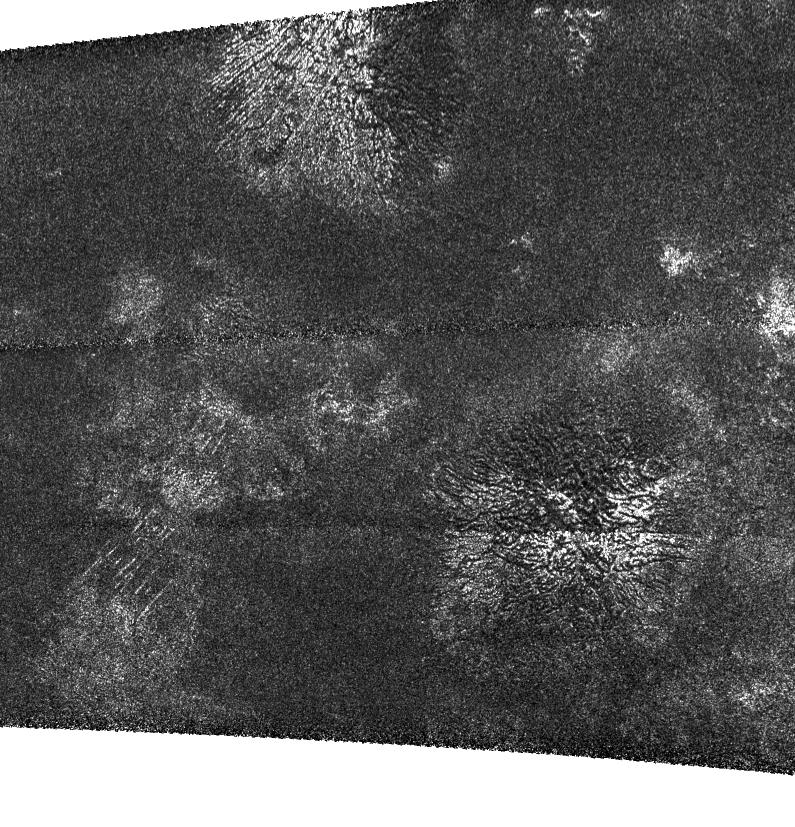
This mosaic of radar images reveals topographic data and mountain chains near Adiri, an equatorial region of Saturn's largest moon Titan. The composite view focuses on a region around 10 degrees south latitude and 145 degrees east longitude.
The radar views used to build this mosaic were obtained by the radar mapper of the Cassini spacecraft on February 22 and October 28, 2005. Landscape features in the black and white image appear bright when they are tilted toward the probe or have rough surfaces.
The color strips were incorporated into the image to provide elevation data of the landscape features. The red areas correspond to the tallest landscape features. In this view, the red areas are about 250 meters (around 820 feet) above the mean radius of the Orange Moon. By contrast, the purple areas correspond to the lowest landscape features. In this view, the purple areas are approximately 450 meters (around 1476 feet) below the mean radius of the moon.
One can notice parallel mountain chains as well as parallel dune fields deflected by bright topographic obstacles. The dune formations are apparently closely related to the action of prevailing winds. The mountains are thought to be engendered by a deformation of the outer water ice layer. The surface tends to ripple due to internal phenomena: a mixture of liquid water and ammonia, influencing tectonics and surface deformation, may hide below the icy crust.

Image Credit: NASA/JPL-Caltech


This mosaic of radar images obtained with the radar instrument of the Cassini spacecraft reveals topographic data and mountains in the northern hemisphere of Titan. The area appears in the north of the Aaru region. The color strips unveil the elevation levels. The red and orange colors unveil the highest land while the purple colors show the lowest terrain.
In the composite image, the highest landscape features appear 600 meters or 2,000 feet above the mean radius of Saturn's largest moon. The lowest terrain turns out to be 800 meters or 2,600 feet below the mean radius of the Orange Moon.
A grid is incorporated into the radar portion to show the latitude and the longitude. A mountainous area can be found near 52 degrees north latitude and 13 degrees east longitude. The tallest mountains, hills or plateaus are approximately 1,400 meters higher than the surrounding valley.
The black and white views used to generate this radar portion were obtained on July 22, September 22, and October 9, 2006. In radar views, landscape features appear bright when they are tilted toward the probe or have rough surfaces. The combination of radar views of the same area allows us to generate 3D views or topographic views of the landscape. A dark and uniform area in a radar image may correspond to a pool of liquids. This radar portion doesn't show any clear sign of lakes or dynamic rivers.

Image Credit: NASA/JPL-Caltech


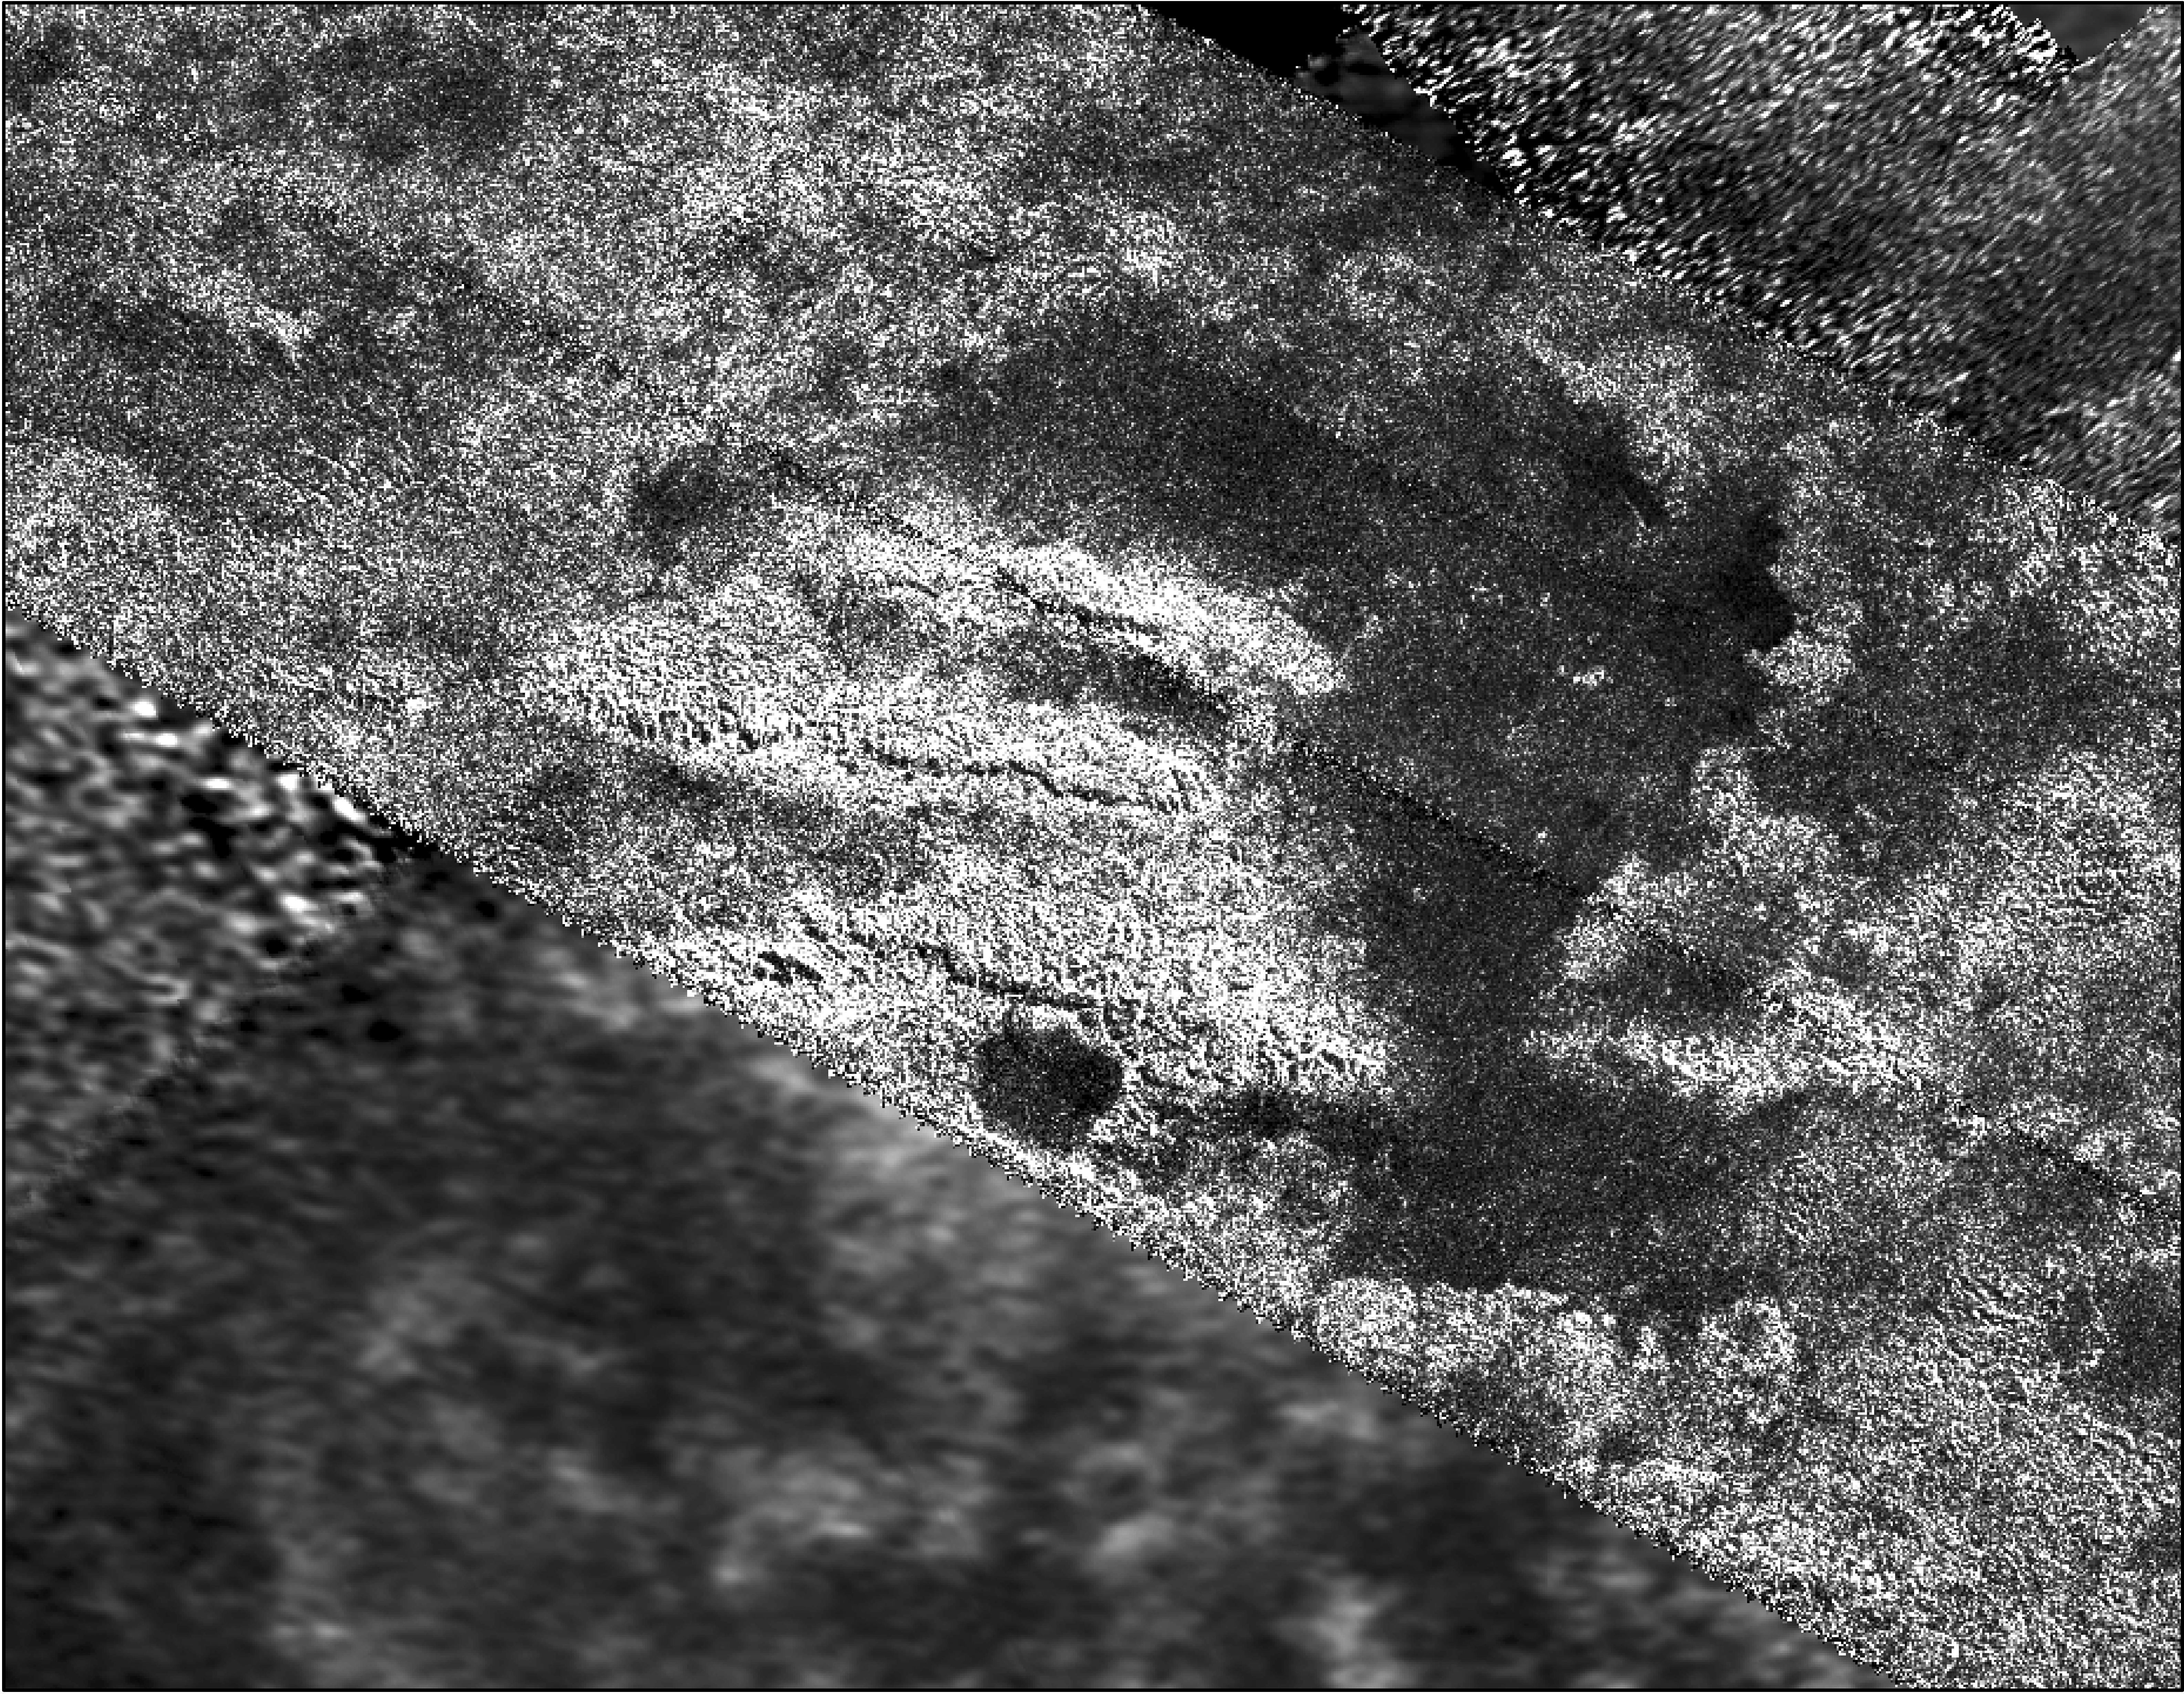
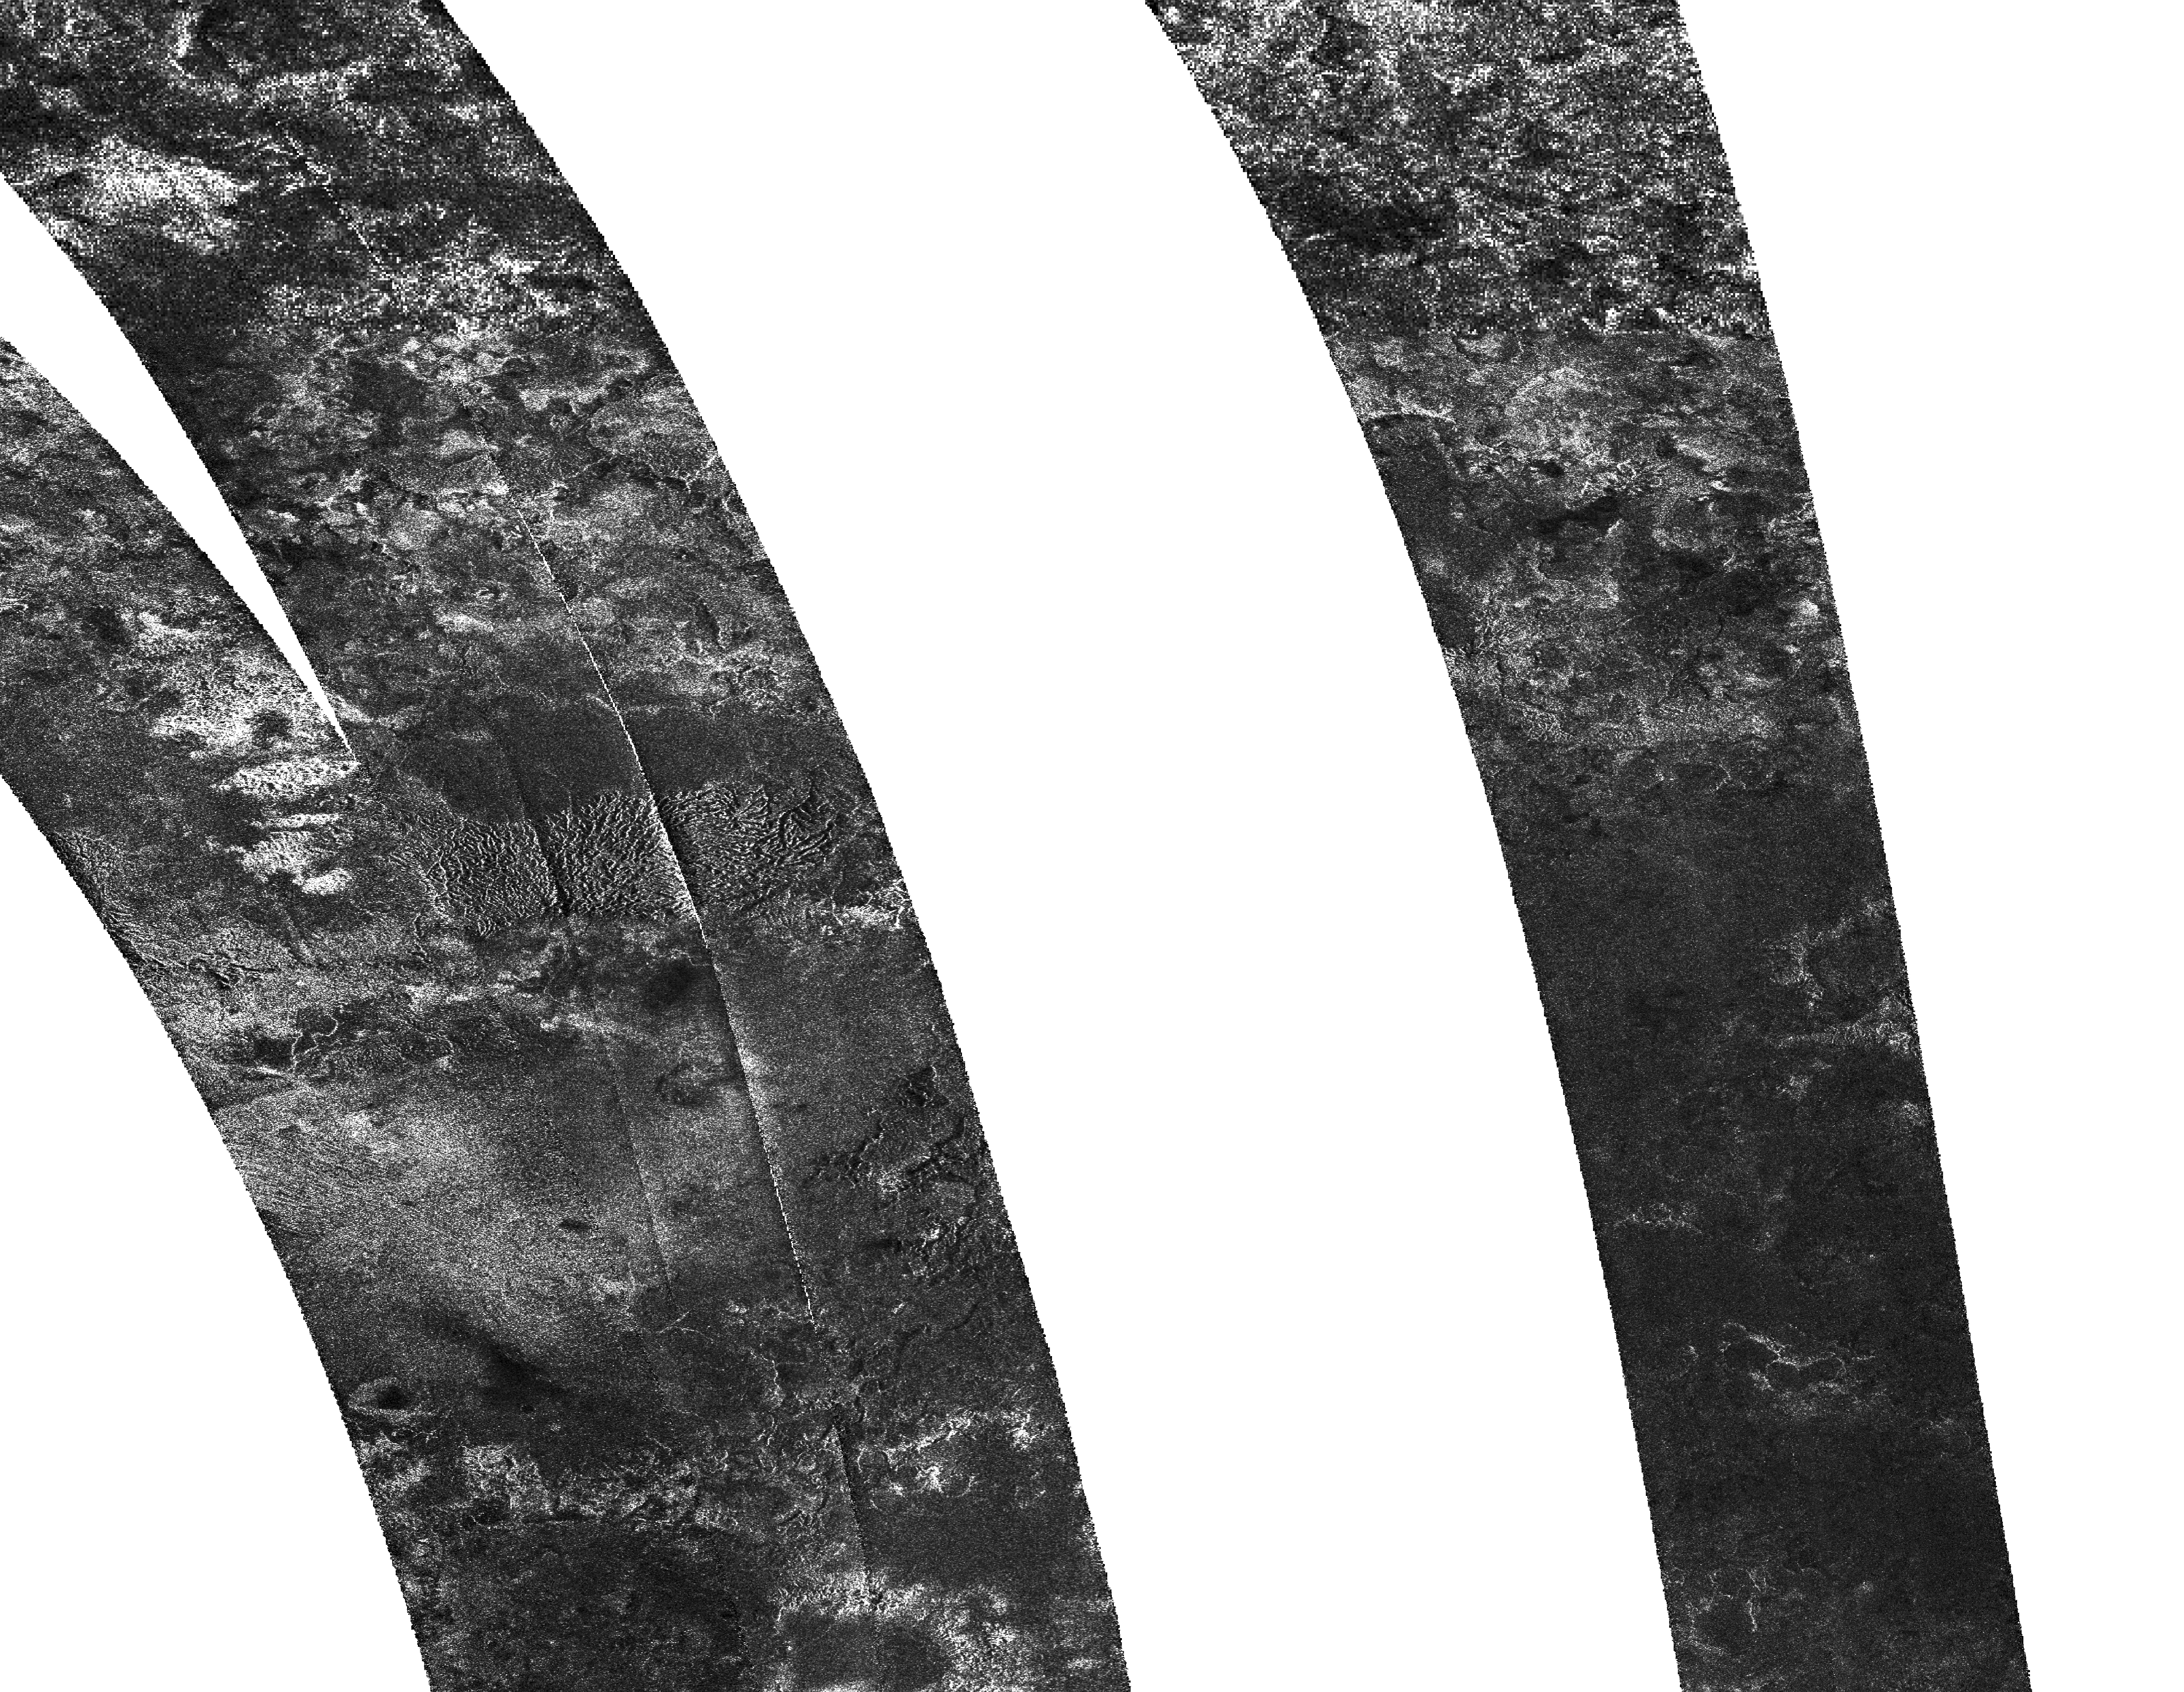
This radar mosaic reveals mountain chains on the northwest border of the bright Xanadu on Titan. Three dark, parallel lines or ridges can be seen in a bright, rugged terrain. A dark, circular feature in that area may correspond to an ancient impact crater or it may represent a cryovolcanic caldera. One can wonder whether there is a close relationship between the formation of the dark, circular feature and the formation of the parallel mountain chains in that bright area.
A grid has been incorporated into the composite image to show the latitudes and longitudes of the landscape features. The mountain chains can be found at about 2 degrees south latitude and minus 127 degrees west longitude. The radar views used to build the mosaic were taken by the Radar Mapper of the Cassini probe on February 15, 2005 and May 12, 2008. The landscape features appear bright or show a high albedo when they are tilted toward the probe or have rough surfaces.
It turns out that the tallest topographic features or mountains are approximately 1,900 meters (or about 6234 feet) taller than the surrounding plains. It is thought that the elevated terrain rose up via a process of deformation of the outer water ice layer. Contractions, extensions and fractures in the crust may account for the formation of the mountain ranges and the surface may crumple or wrinkle like a raisin.

Image Credit: NASA/JPL-Caltech


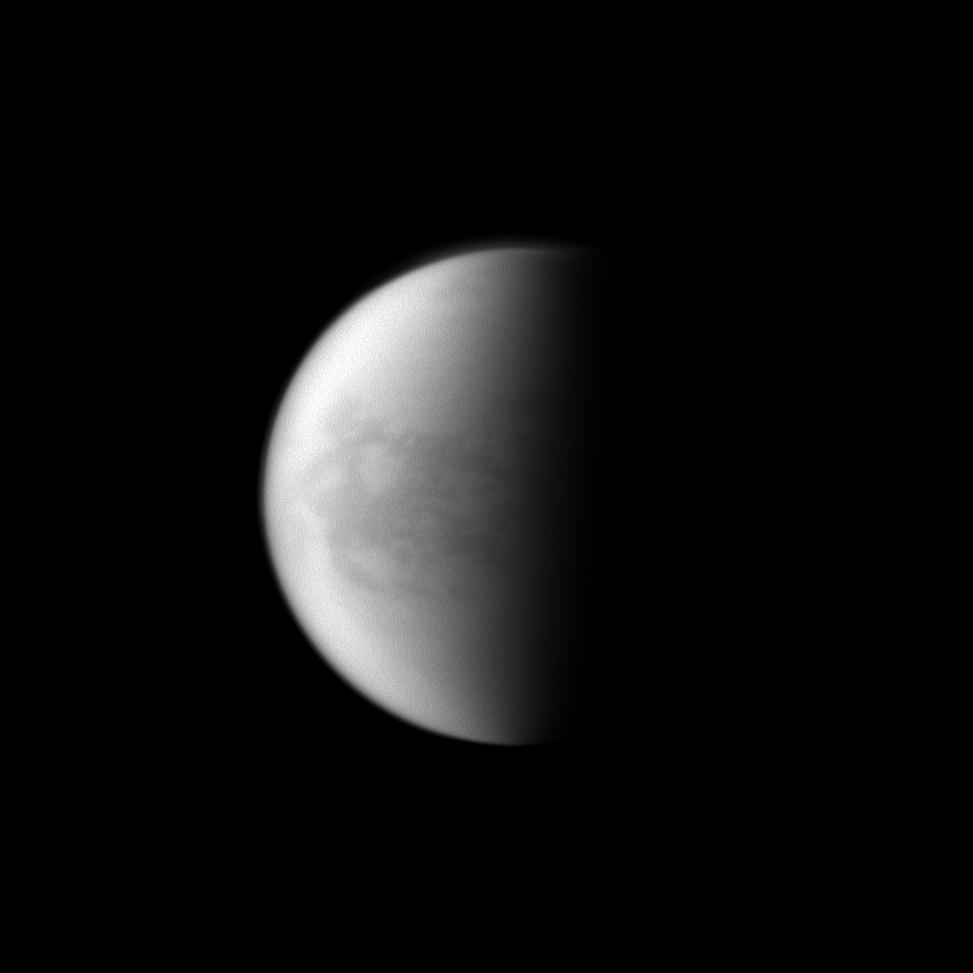
This view of Saturn's largest moon, Titan, reveals the seasonal atmospheric banding. One can observe a dark atmospheric band in the north polar region as well as a linear atmospheric contrast near the equator, marking a seasonal dichotomy between the northern and southern hemispheres.
The image was acquired in visible violet light with the ISS Wide-Angle Camera of the Cassini spacecraft on June 21, 2010. The view was taken at a distance of about 170,000 kilometers or 106,000 miles from the Orange Moon and at a Sun-Titan-Probe, or phase, angle of 33 degrees. The camera is orientated toward the anti-Saturn side of the Opaque Moon. North is up and inclined 23 degrees to the left.
The northern hemisphere is now experiencing the spring season whereas the southern hemisphere is experiencing the autumn season. The banding pattern is thought to be closely related to seasonal factors. A dark polar cap may appear above the south polar region in the next winter season.

Image Credit: NASA/JPL/Space Science Institute


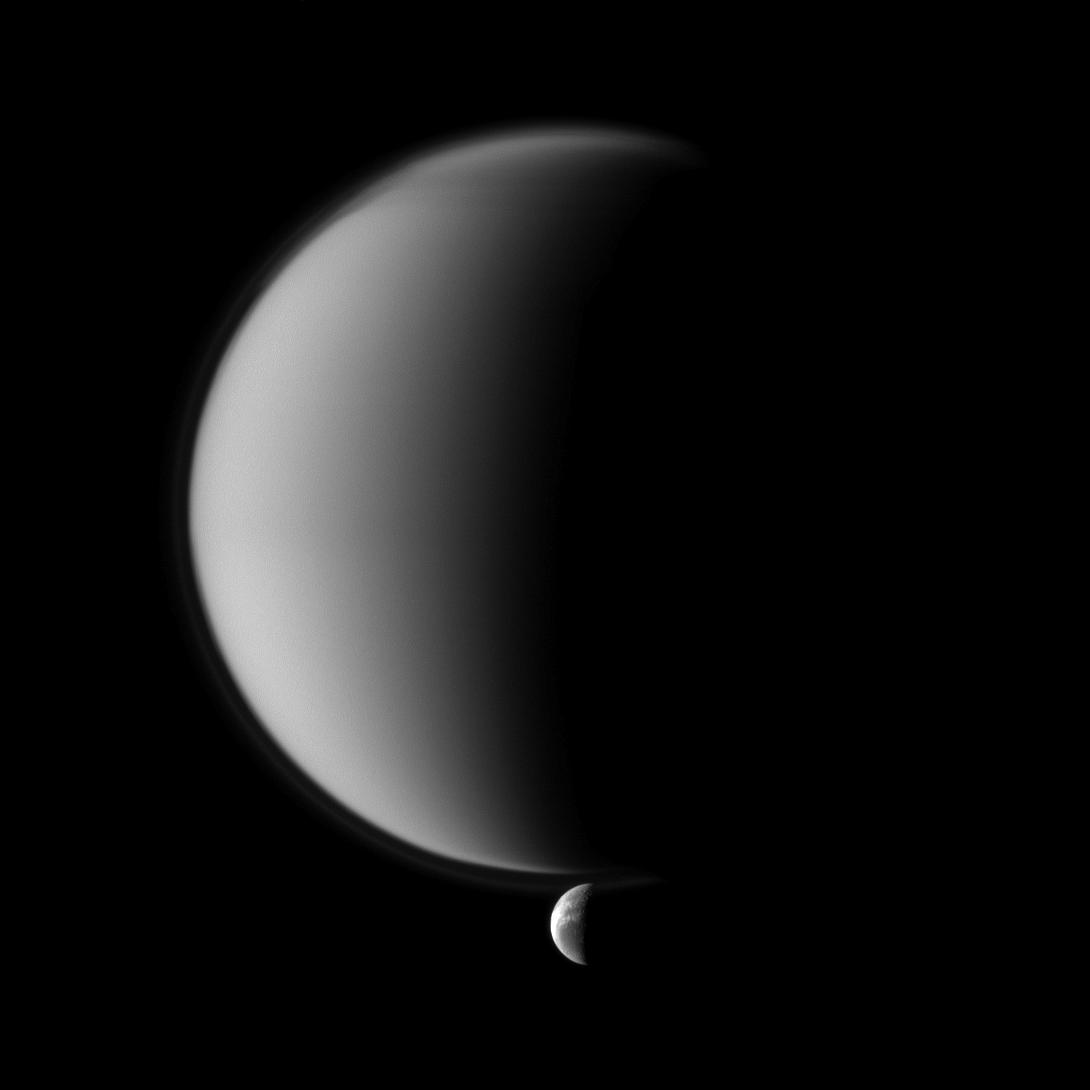
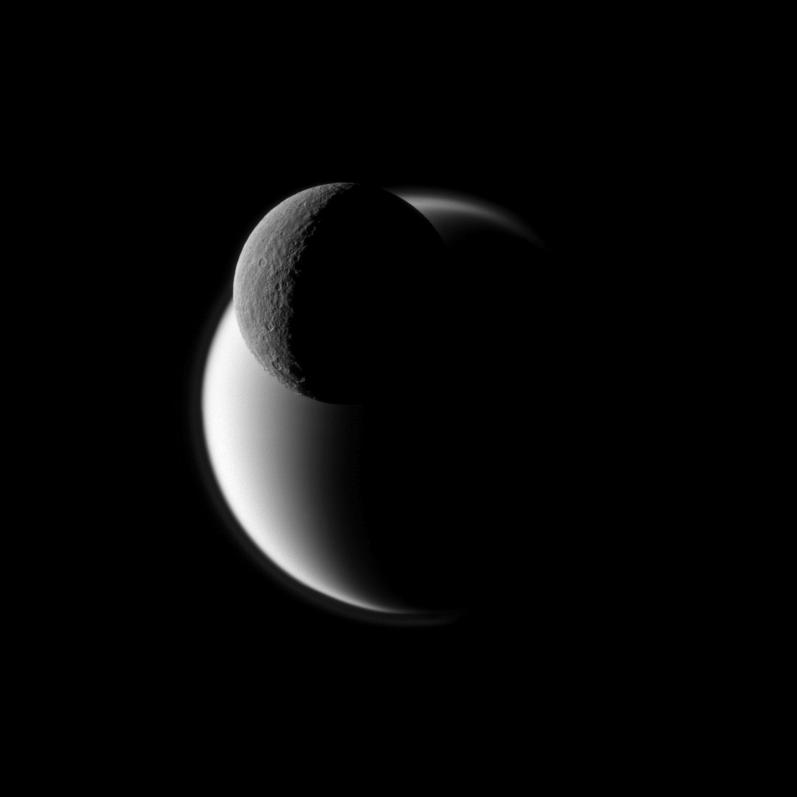
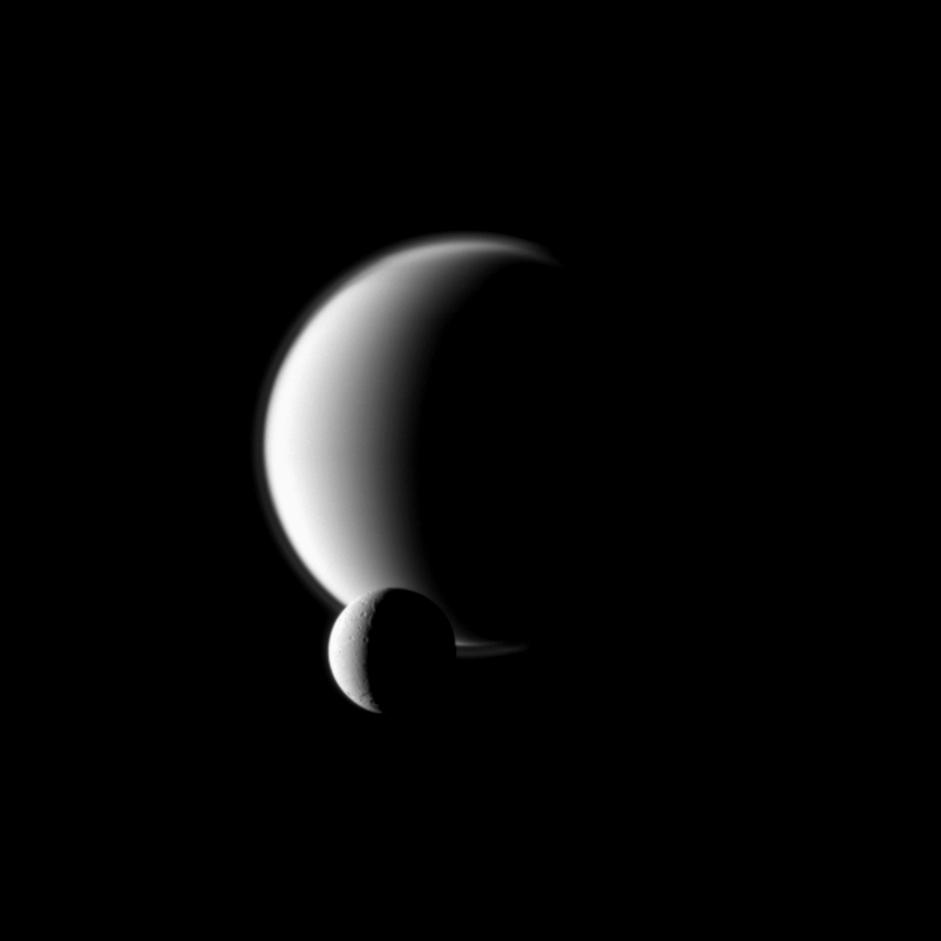
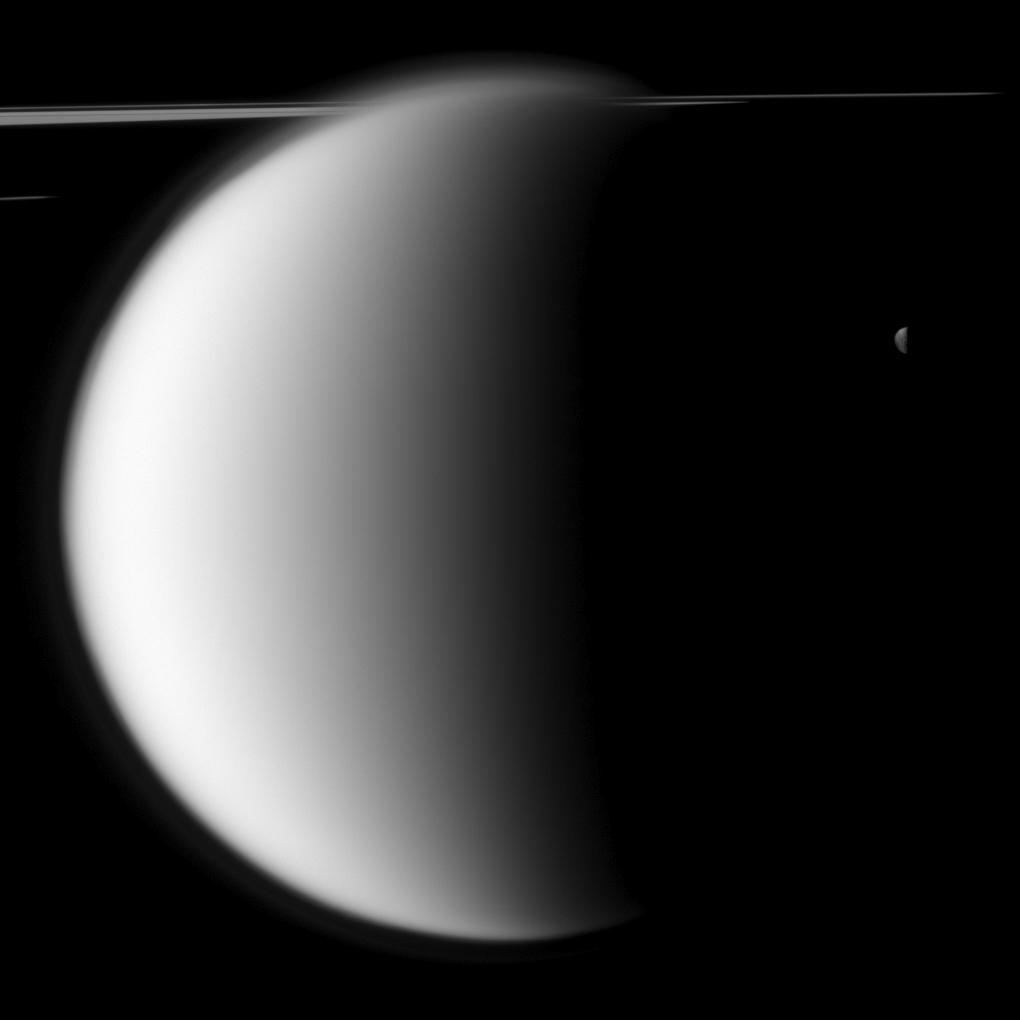
This view shows the Opaque Moon Titan and the icy moon Dione which orbits closer to Saturn. Saturn's largest moon is in the upper part of the image and the crescent of Dione appears at the bottom of the view. Titan is covered with a thick and dense atmosphere while Dione is devoid of any atmosphere.
One can notice the significant contrast between the two moons: the surface of Titan is not visible with the human eye due to the opaque atmosphere. The surface of Dione appears to be particularly reflective with bright icy cliffs in its trailing hemisphere. Moreover, one can observe the detached haze layer in the upper atmosphere of Titan as well as the north polar hood of the Orange Moon.
Dione is moving around Saturn at a mean distance of 377,396 km or 235,000 miles whereas Titan orbits further from the Ringed Planet at a mean distance of 1,221,870 km or 760,000 miles. Dione is about 1,123 km or 698 miles in diameter and Titan is largely bigger with a mean diameter of 5,150 km or 3,200 miles.
The view was obtained in visible blue light with the ISS narrow-angle camera of the Cassini probe on April 20, 2010. The image was taken at a distance of about 2.3 million kilometers or 1.4 million miles from Dione and at a Sun-Dione-probe, or phase, angle of 101 degrees. The view was acquired at a distance of about 1.3 million kilometers or 808,000 miles from Titan and at a Sun-Titan-probe, or phase, angle of 101 degrees. The illuminated terrain observed here is on the trailing hemisphere of Dione and in the area between the trailing hemisphere and anti-Saturn side of the Orange Moon.

Image Credit: NASA/JPL/Space Science Institute


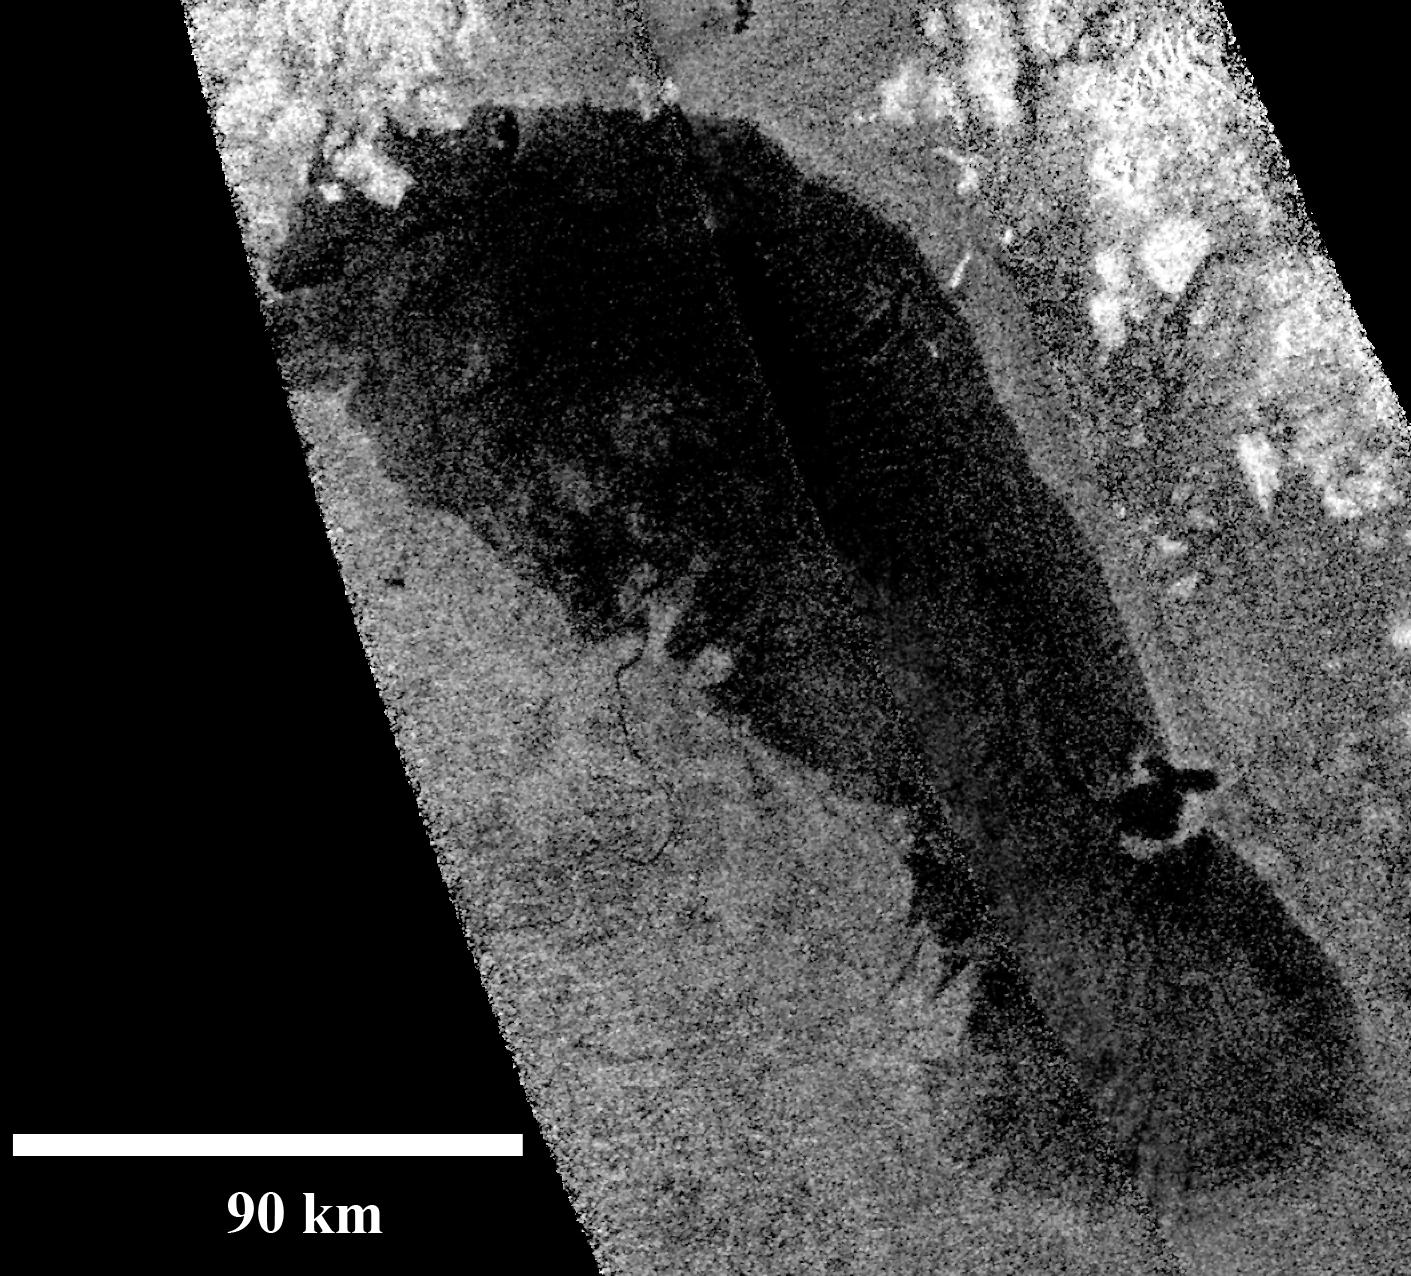
This radar view unveils the dark kidney-shaped area of Ontario Lacus in the southern hemisphere of Saturn's largest moon Titan. Ontario Lacus appears to be the largest pool of liquids in the south polar region. The lake is approximately 235 km long and is centered at 72 degrees south latitude, 183 degrees west longitude.
Ontario lacus covers about 15,000 square kilometers or 6,000 square miles and is a little smaller than Lake Ontario on our planet. The image was taken by the Radar Mapper of the Cassini spacecraft on January 12, 2010. North appears in the upper part of the view.
The lake is likely composed of a mixture of methane, ethane and propane. These molecules can appear in their liquid form in the harsh environment of the Orange Moon. The surface temperature of the area averages 90 Kelvin, -300 degrees Fahrenheit or -183 degrees Celsius.
Ontario Lacus appears relatively dark and uniform suggesting a smooth and absorbing area. That corresponds to the radar signature of liquids. One can infer the depth of the lake on the basis of the level of darkness. Along the shoreline in the left part of the lake, the albedo is higher and not as uniform as in the right part of the lake, suggesting that the slope and the depth are lower.
The bright patches correspond to a high radar return or high albedo. This can be interpreted by the fact that the topographic features are tilted toward the Cassini probe. The bright patches may also correspond to the presence of a reflective material such as water ice or frozen carbon dioxide. The bright patches may correspond to rough surfaces, as well.
The northern coastline reveals flooded river valleys and hills as high as 1 kilometer or 3,000 feet in altitude. One can notice a delta and a river in the middle part of the western rim of Ontario Lacus. It appears that the drainage channel which drives liquids from a higher plain has engendered the two coastal lobes. That geologic phenomenon with flow patterns and delta formation can be observed on Earth at the southern end of Lake Albert between the Democratic Republic of Congo and Uganda in Africa.
In some areas, along the shoreline, one can observe tha apparent action of waves which carve the rims. That 's well observed on Earth on the southeastern side of Lake Michigan. Prevailing winds are likely blowing from the west or southwest and the waves are likely small.
A surprising bay can be observed in the southeast part of the lake with two dark extensions. One extension of the bay penetrates into the uniform terrain. The rupture in the linear coastline is hard to explain and the bay appears to be particularly deep. Is it related to an impact crater or a cryovolcano?

Image Credit: NASA/JPL-Caltech


The infrared image above reveals a crescent of Titan's disk. The dark low-latitude region Belet can be observed in the illuminated area of Saturn's largest moon. It seems that Kraken Mare, the giant pool of liquids in the north polar region, can be identified in the upper part of the disk. The illuminated terrain appears between the trailing hemisphere and Saturn-facing side of the Orange Moon and north is up.
The global view was obtained with the ISS narrow-angle camera of the Cassini probe on April 24, 2010 using a spectral filter sensitive to wavelengths of infrared radiation centered at 938 nanometers. The image was taken at a distance of about 1.9 million kilometers or 1.2 million miles from the Opaque Moon and at a Sun-Titan-spacecraft, or phase, angle of 82 degrees.

Image Credit: NASA/JPL/Space Science Institute


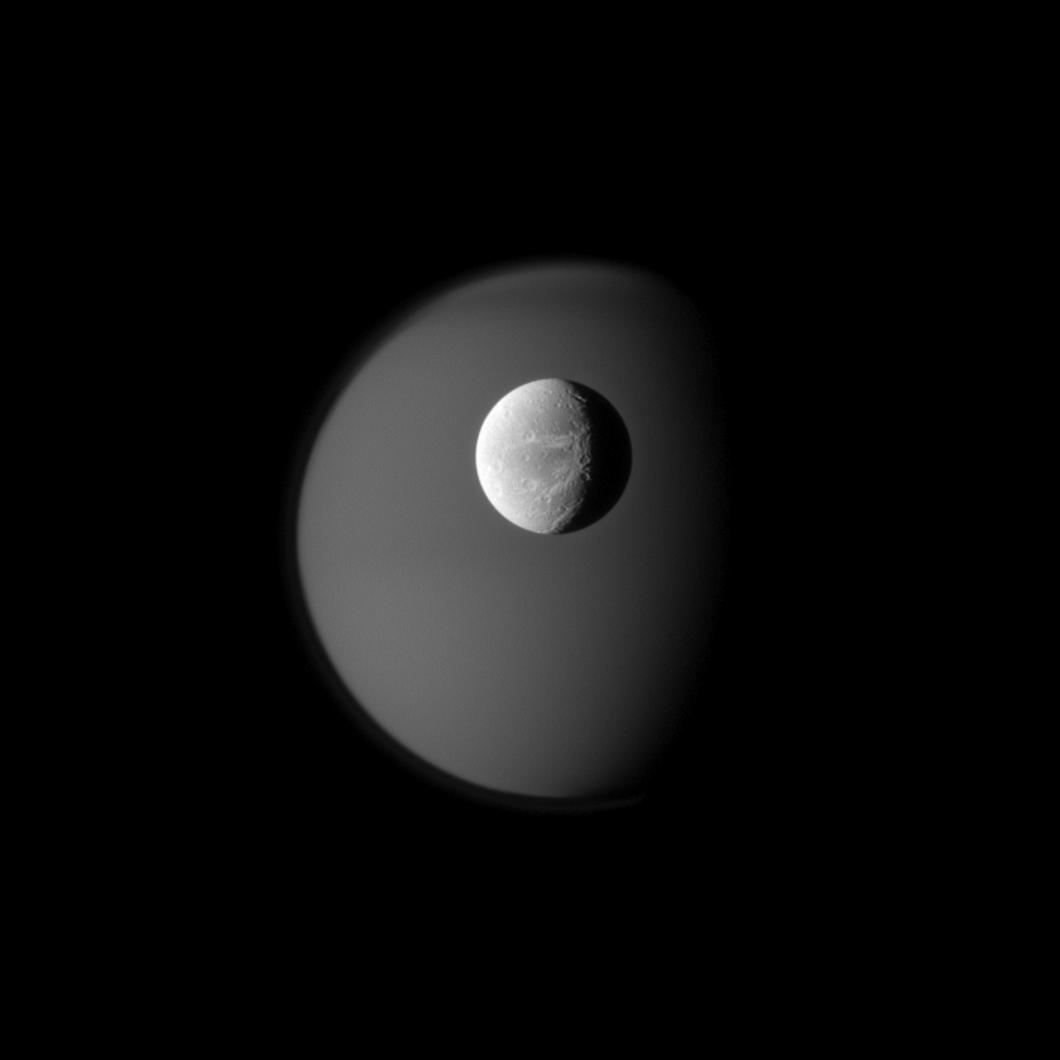
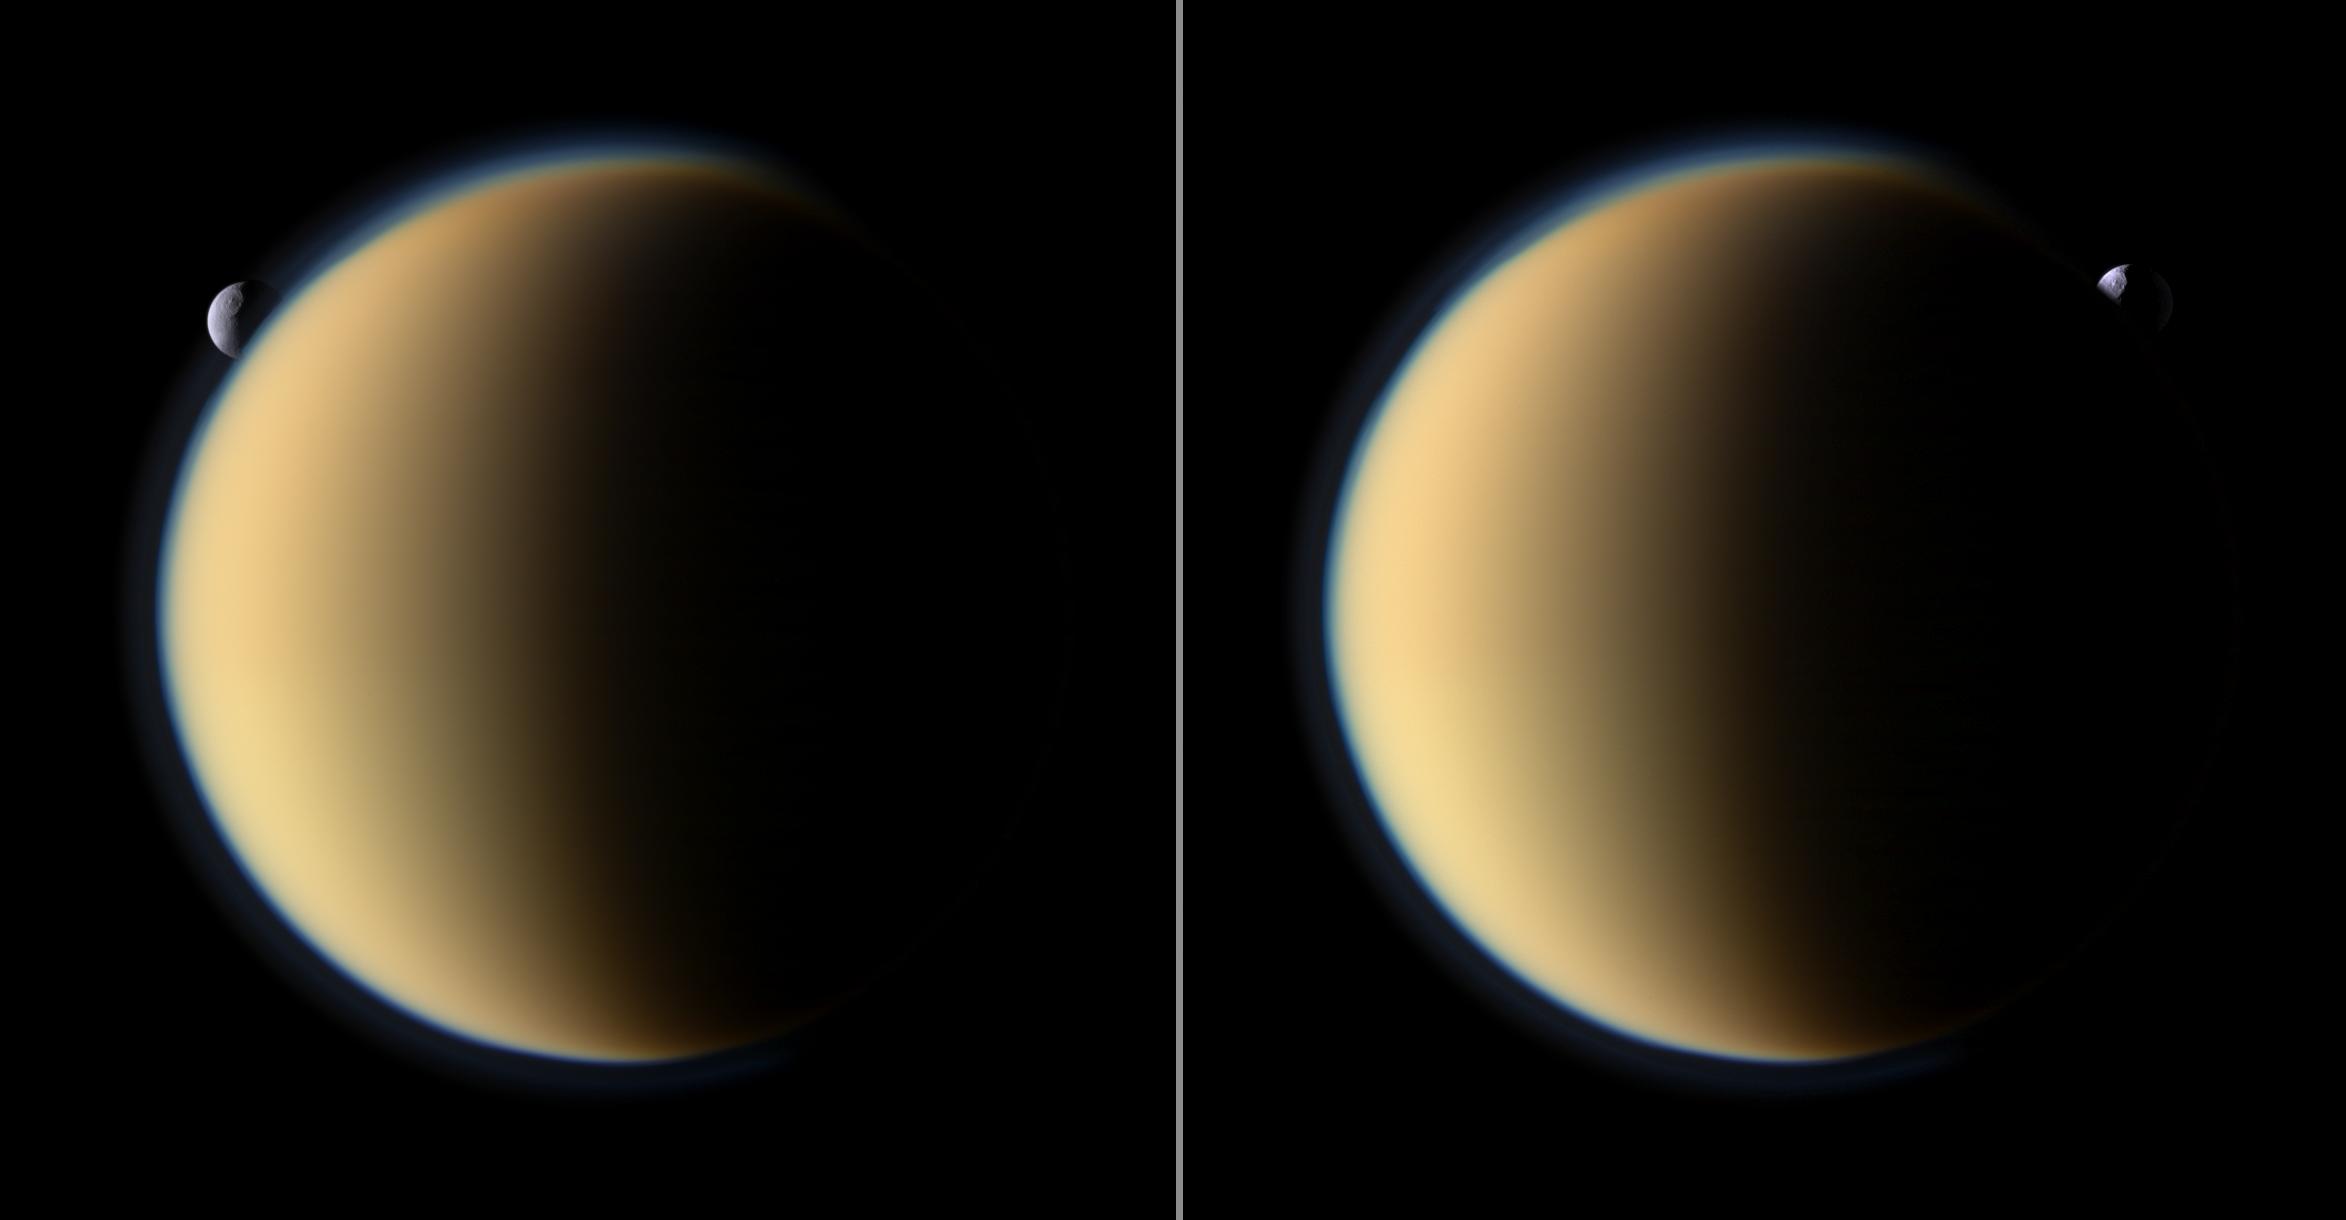
This view acquired from the Cassini spacecraft on April 10, 2010 shows Saturn's moon Dione moving in front of the hazy, ghostly Titan. Surface features such as bright streaks or craters of the bright moon Dione can be clearly discerned in the image.
A portion of the bright ice cliffs in the trailing hemisphere of Dione can be observed on the right. The ice cliffs of the icy moon are likely generated by tectonic forces. The camera is orientated toward the Saturn-facing hemisphere of Titan and Dione.
One can notice that the north polar region of the opaque moon Titan is covered by a dark atmospheric banding, known as the dark polar hood. The dark polar bands are thought to be closely related to seasons.
Titan appears to be the largest moon of Saturn with a diameter of about 5,150 km or 3,200 miles. Dione, approximately 1,124 km or 700 miles in diameter, orbits closer to Saturn with a semi-major axis of 377,396 km or 234,410 miles. The semi-major axis of Titan's orbit around Saturn is about 1,221,870 km or 760,000 miles.
The view was obtained in visible blue light with the ISS narrow-angle camera of the Cassini spacecraft. The image was taken at a distance of about 1.8 million kilometers or 1.1 million miles from Dione and 2.7 million kilometers or 1.7 million miles from the Orange Moon. The view has been magnified by a factor of 1.5 and contrast-enhanced to improve visibility.

Image Credit: NASA/JPL/Space Science Institute


This global view of Saturn's largest moon Titan clearly shows the dark low-latitude regions Fensal, Aztlan and Senkyo. Fensal and Aztlan separated by the bright Quivira in the left part of the disk form a topographic "H". The dark Aztlan appears below the equator and the dark Fensal is located north of Aztlan. The bright region below the topographic H is called Tsegihi.
To the east of Fensal and Aztlan, one can notice the dark low-latitude region called Senkyo. Above Senkyo, in the upper part of the disk, one can identify a slightly dark landscape feature which appears to be a portion of Kraken Mare. Kraken Mare is probably the largest body of liquids on the surface of the Orange Moon. Kraken Mare, likely composed of ethane and methane, is situated in the north polar region.
The portion of the moon visible here mostly corresponds to the Saturn-facing side of Titan. North appears in the upper part of the disk and is inclined 9 degrees to the left. The view was obtained with the ISS narrow-angle camera of the Cassini probe on April 8, 2010 using a spectral filter sensitive to wavelengths of near-infrared radiation centered at 938 nanometers. The image was acquired at a distance of about 2.1 million kilometers or 1.3 million miles from the Opaque Moon and at a Sun-Titan-spacecraft, or phase, angle of 33 degrees.

Image Credit: NASA/JPL/Space Science Institute


This near-infrared portion shows the Belet area on Saturn's largest moon Titan. The bright patches are not clouds or atmospheric features. They represent topographic or surface features. The bright patches are high-albedo areas or particularly reflective areas. By contrast, dark areas present a lower albedo which implies that they reflect a smaller portion of the incoming radiations.
The dark portion in the upper left part of the view represents Belet, a low-albedo region located in the Tropics of the Orange Moon. The region can be found, approximately, between 240 degrees west longitude and 210 degrees west longitude, above 30 degrees south latitude. The dark regions in the low latitudes of Titan tend to be dominated by dune fields or Seif dunes. The bright Adiri can be found in the upper right portion of the view.
The area lies in the trailing hemisphere of the Opaque Moon. The view was obtained with the ISS narrow-angle camera of the Cassini probe on December 28, 2009 using a spectral filter sensitive to wavelengths of near-infrared radiation centered at 938 nanometers. Tha image was acquired at a distance of about 282,000 kilometers or 175,000 miles from the Hazy Moon and at a Sun-Titan-probe, or phase, angle of 45 degrees. Belet was named after a Malay afterworld reached by a flower-lined bridge. Belet is centered at approximately 5 degrees south latitude, 255 degrees west longitude.

Image Credit: NASA/JPL/Space Science Institute


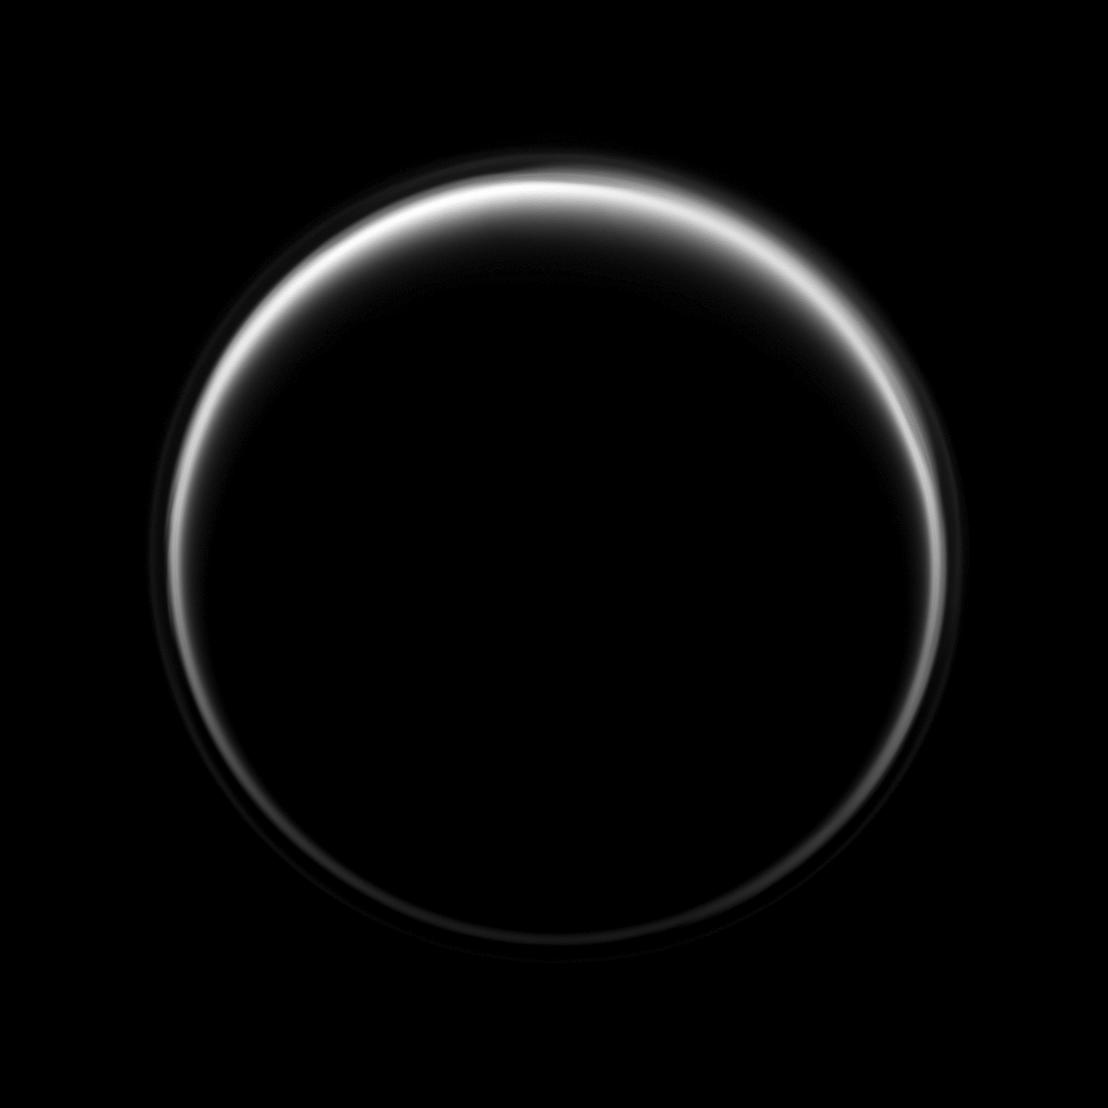
This ultraviolet view of Titan's disk clearly shows the detached, high-altitude haze layer in the upper part of the atmosphere. A large part of the disk of Saturn's largest moon is not illuminated by the solar light. As a result, very few atmospheric features can be discerned in the global image.
The upper part of the opaque atmosphere undergoes complex photochemical processes involving hydrocarbons which interact with ultraviolet light to form new molecules. The narrowing circle of light in the boundaries of the atmosphere is generated by sunlight scattering through the gas layer.
In this global view, north on the Orange Moon is up and inclined 10 degrees to the right. The view was obtained with the ISS narrow-angle camera of the Cassini probe on March 16, 2010 using a spectral filter sensitive to wavelengths of ultraviolet radiations centered at 338 nanometers. The image was taken at a distance of about 1.9 million kilometers or 1.2 million miles from the Opaque Moon and at a Sun-Titan-probe, or phase, angle of 158 degrees.

Image Credit: NASA/JPL/Space Science Institute


This view of Titan's disk reveals the brightness dichotomy between the southern hemisphere and the northern hemisphere. One can clearly notice the dark hood in the north polar region of Saturn's largest moon.
The image was obtained in visible blue light with the ISS narrow-angle camera of the Cassini probe on March 22, 2010. The view was acquired at a distance of about 2 million kilometers or 1.2 million miles from the Orange Moon and at a Sun-Titan-probe, or phase, angle of 38 degrees.
The camera is orientated toward the Saturn-facing side of the Opaque Moon. North on the moon appears in the upper part of the disk. North is tilted 45 degrees to the left.
The view of the globe clearly shows the upper part of the atmosphere with its detached haze layers. Banding patterns in the atmosphere around the north polar region can be clearly identified.
The brightness asymmetry between the northern hemisphere and the southern hemisphere appears to be closely linked to seasons. The northern hemisphere is currently running toward the summer season. By contrast, the southern hemisphere is currently running toward the winter season.

Image Credit: NASA/JPL/Space Science Institute


This set of images shows a radar portion of Saturn's largest moon ,Titan. The radar strip was obtained by the radar mapper of the Cassini spacecraft on May 28, 2008 and it represents the last swath acquired during Cassini's prime mission. The top view corresponds to the radar swath. The second view represents the radar swath with color boxes incorporated to show key locations on the moon. The lower view represents a cylindrical projection map of the globe with the radar swath incorporated to indicate where the key places are situated. One can notice that the radar strip crosses the bright area called Xanadu.
In the blue map of the Orange Moon, the dark horizontal lines represent latitudes and the dark vertical lines represent longitudes. The map is divided into lines which are spaced about 30 degrees apart. One can observe that the radar strip crosses the line of the equator. This radar arc extends from about 25 degrees north latitude, 225 degrees west longitude to about 30 degrees south latitude, 100 degrees west longitude, in a broad arc roughly 6,000 kilometers or 3,730 miles long and about 170 kilometers or 105 miles wide in its narrowest portion. Illumination comes from the north or the top. The left part of the blue map corresponds to the west and the right part corresponds to the east.
In the radar mosaic, the landscape features appear bright when they are tilted toward the probe or when they have rough surfaces. The green box in the annotated version of the radar arc reveals an equatorial area dominated by dune fields shaped by prevailing winds. The area is particularly absorbing suggesting that the material is probably made of organics rather than water ice or frozen carbon dioxide. One can notice bright topographic obstacles which deflect or stop dune fields or Seif dunes in that area. A dark, round feature surrounded by a bright material suggests an ancient meteoritic impact but it may also be linked to cryovolcanism.
The yellow box shows the bright continent Xanadu, probably dominated by water ice or frozen carbon dioxide. The region likely undergoes tectonics and cryovolcanic events. The red box inside Xanadu shows the boundary between the bright area and a dark, semi-circular area where bright channels connected to the bright area can be clearly identified. They likely represent dry river beds. Do they represent ancient lava flows resulting from a cryovolcanic eruption within the bright Xanadu? The dark area seems to represent a drainage basin. This area may also be an ancient impact crater. The delta can be as wide as about 5 kilometers or 3 miles wide which roughly corresponds to the size of the River Thames at its mouth east of London.
The blue box in the annotated version of the radar strip reveals a portion of Xanadu dominated by what appear to be mountain ranges. The linear and parallel features suggest a tectonic activity engendering hills and mountains. Xanadu seems to be made of a rough terrain with hills and mountains of reflective materials. Several bright meandering channels can be clearly spotted within the bright Xanadu.

Image Credit: NASA/JPL-Caltech


This set of images reveals a radar swath of Titan's surface acquired on May 12, 2008 by the radar mapper of the Cassini probe. The image in the upper part corresponds to the radar portion. The second image from top represents the radar swath with annotations or rectangles to show key topographic locations. Thre lower view represents a map of the moon incorporating the radar swath.
The bright patch crossed by the radar portion in the blue map represents the high-albedo area known as Xanadu. The radar swath extends from roughly 25 degrees north latitude, 215 degrees west longitude to about 30 degrees south latitude, 75 degrees west longitude. This radar swath or arc is about 6,500 kilometers or 4000 miles long and roughly 150 kilometers or 95 miles wide in the narrowest portion of the swath. Illumination comes from the north or top. The blue map reperesents a cylindrical projection map of Saturn's largest moon. The longitudes are represented by dark vertical lines which are spaced about 30 degrees apart. The latitudes are represented by dark horizontal lines which are spaced about 30 degrees apart.
The radar swath runs from west (left) to east (right). In the left part of the radar swath, one can observe a circular feature with bright rims. It seems to represent an impact crater but it may also be a cryovolcanic feature or a caldera. The green box in the annotated version of the radar swath corresponds to a low-latitude area dominated by dune fields or Seif dunes. Prevailing winds appear to play a significant role in carving or shaping the landscape. The topographic features bring significant clues for the orientation of winds. Bright patches tend to appear as topographic obstacles against the action of dune fields.
The yellow box reveals the reflective area of Xanadu. Past measurements from the Cassini spacecraft suggest that Xanadu is flat. The bright features of Xanadu suggest an irregular or rough terrain. Xanadu seems to be a hilly region made of reflective materials such as water ice, ammonia ice or frozen carbon dioxide. Some bright meandering lines in Xanadu suggest the presence of mountain ranges and tectonics.
The red box within the Xanadu region unveils three dark parallel lines in a particularly bright area where a dark circular feature can be found. The parallel lines imply an unstable crust undergoing the action of tectonics. Does the dark feature represent a caldera or is it the outcome of a meteoritic impact? The blue box shows the region of Hotei Regio which is believed to be a cryovolcanic area. Some bright channels can be clearly seen.
Scientists suggest that they are likely composed of a mixture of ammonia and water. A stereo view of Hotei Regio was constructed on the basis of two views of the area with different angles. The bright lobes appear to be 100 to 200 meters in thickness or 330 to 670 feet in thickness. Topographic features appear bright when they are tilted toward the probe or have rough surfaces.

Image Credit: NASA/JPL


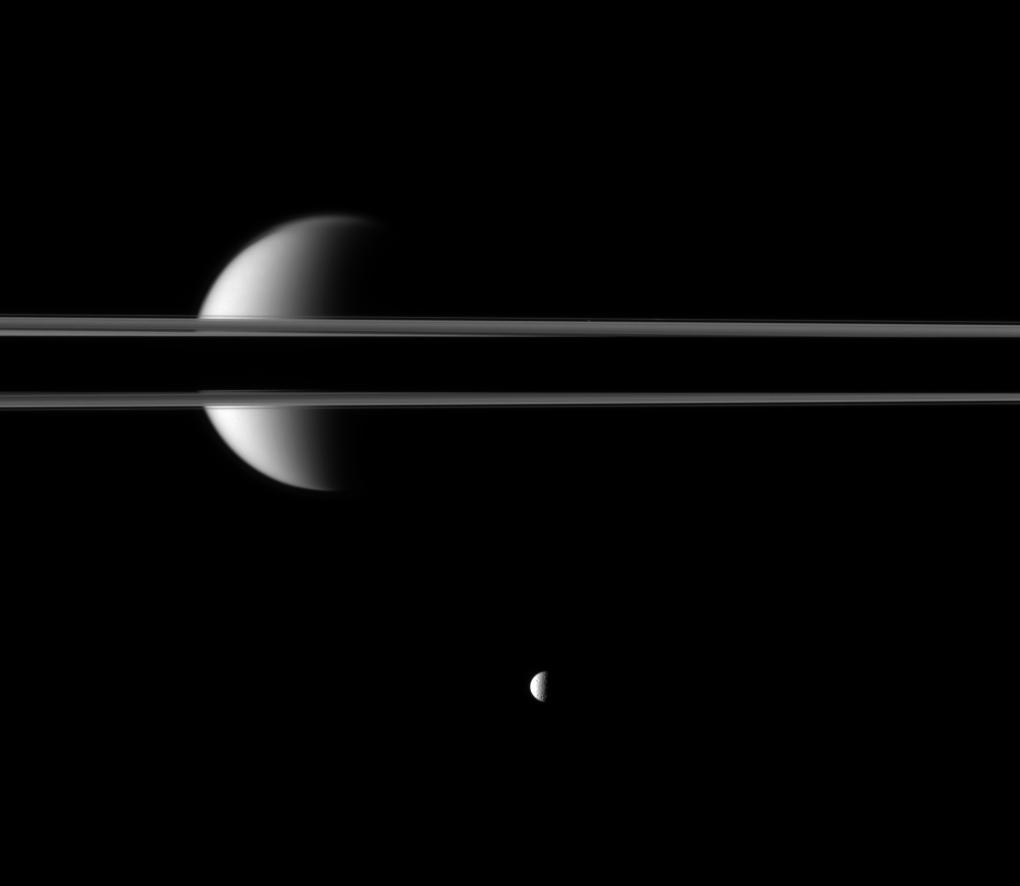
This view reveals a surprising geometrical configuration in the Saturn System with Titan crossing the ring plane of Saturn on the horizon and the icy moon Mimas in the lower part of the image below the rings.
The Orange Moon Titan is visible through the gaps of the rings which are partially darkened by the shadow of the Gas Giant. The night side of Saturn, out of the image, lies to the left. The illuminated part of Titan and Mimas shows the orientation of solar radiations. Mimas, 396 kilometers or 246 miles in diameter, which is smaller than Titan is closer to the camera.
Another moon, Atlas, 30 kilometers or 19 miles across can be identified in the view near the F ring just to the right of center on the upper portion of the ring. The illuminated terrain on the Opaque Moon corresponds to the region between the leading hemisphere and the Saturn-facing side. The view is orientated toward the northern, sunlit side of the rings from just above the ringplane.
The view was obtained in visible green light with the ISS narrow-angle camera of the Cassini probe on March 26, 2010. The image was captured at a distance of about 3.5 million kilometers or 2.2 million miles from the Orange Moon and 2.1 million kilometers or 1.3 million miles from Mimas.

Image Credit: NASA/JPL/Space Science Institute


This near-infrared view shows surface features in the bright region Adiri on Saturn's largest moon Titan. Adiri is located to the west of the dark region Shangri-La where the Huygens probe landed on January 14, 2005. The landscape portion is centered on terrain at 22 degrees south latitude, 209 degrees west longitude. North appears in the upper part of the view and is tilted 36 degrees to the right.
The image was acquired with the Cassini probe narrow-angle camera on December 12, 2009 using a spectral filter sensitive to wavelengths of near-infrared radiation centered at 938 nanometers. The area was obtained at a distance of about 130,000 kilometers or 81,000 miles from the Orange Moon.
Adiri appears particularly bright which implies that it reflects a large part of the incoming radiations. By contrast, Shangri-La and Belet appear dark in the near-infrared spectrum which implies that they reflect a smaller portion of the incoming light. Adiri is believed to be mostly composed of water ice and frozen carbon dioxide whereas the dark regions are thought to be relatively rich in organics or hydrocarbons.

Image Credit: NASA/JPL/Space Science Institute


This near-infrared view of Titan's disk shows the optically-dark area of Belet located within the "Tropics" of Saturn's largest moon. The narrow-angle camera of the Cassini spacecraft is focused toward the trailing hemisphere of the Orange Moon. North is in the upper part of the disk and is inclined 2 degrees to the right.
The global view was obtained on January 15, 2010 using a spectral filter sensitive to wavelengths of near-infrared radiation centered at 938 nanometers. The image was taken at a distance of about 1.2 million kilometers or 746,000 miles from the Opaque Moon and at a Sun-Titan-probe, or phase, angle of 51 degrees.
Belet appears dark in the infrared spectrum which implies that it has a relatively low albedo or that the amount of light absorbed by the surface is relatively high. Belet can be found in the equatorial area below 30 degrees south and north latitude between 270 degrees west longitude and 240 degrees west longitude.
Belet is situated to the west of the bright region Adiri and to the east of the dark Senkyo. The dark regions tend to be concentrated in the tropics or the low latitudes of the moon. Radar images show that Seif dunes or linear dune fields dominate the dark equatorial areas where prevailing winds appear to shape or carve the landscape.

Image Credit: NASA/JPL/Space Science Institute


This view obtained in visible blue light with the ISS narrow-angle camera of the Cassini probe on March 12, 2010 shows the icy moon Dione passing in front of Saturn's largest moon Titan.
The image was captured at a distance of about 2.2 million kilometers or 1.4 million miles from Dione and 3.6 million kilometers or 2.2 million miles from Titan. The view has been magnified by a factor of 1.5 and the contrast has been increased in order to improve visibility. The illuminated terrain observed here is on the anti-Saturn side of Dione and the leading hemisphere of the Orange Moon Titan.
Dione which is approximately 1123 km across or 698 miles across orbits the Ringed Planet at a mean distance of about 377 396 km or 235 000 miles whereas Titan moves farther from Saturn at a mean distance of approximately 1 221 870 km. Titan is largely bigger with a diameter of about 5150 km.
The visual configuration of the image and the sequence of images of the two moons in which Dione passes in front of the Opaque Moon Titan enable scientists to improve their understanding of the orbits of the moons.
Some craters can be clearly seen on the lit terrain of Dione. The detached haze layer in the upper part of Titan's deep and opaque atmosphere can be clearly identified, as well.

Image Credit: NASA/JPL/Space Science Institute


This near-infrared view of Titan's disk clearly reveals the upper boundaries of the thick, dense and opaque atmosphere of Saturn's largest moon. A detached, upper haze layer appears in the upper part of the gas blanket encircling the Orange Moon.
This image shows the leading hemisphere of Titan. North on Titan, located in the upper part of the disk, is inclined 32 degrees to the right. The illumination from the Sun is on the other side of the globe. The light from the Sun is scattered through the atmosphere generating the circle of light unveiling the upper part of Titan's atmosphere.
The atmospheric pressure on the surface of Titan was recorded at about 1467 hPa by the Huygens probe on January 14, 2005. The gas layer is primarily made up of nitrogen. There are also significant amounts of methane as well as other hydrocarbons.
The view was acquired with the narrow-angle camera of the Cassini probe on August 7, 2009 using a spectral filter sensitive to wavelengths of near-infrared radiations at 619 nanometers. The shot was captured at a distance of about 1.2 million kilometers or 746,000 miles from the Orange Moon and at a Sun-Titan-spacecraft, or phase, angle of 160 degrees.

Image Credit: NASA/JPL/Space Science Institute


This image shows the Orange Moon, Titan, in the foreground and Rhea in the background, beyond Saturn's largest moon. Rhea orbits closer to Saturn than Titan at a mean distance of about 527,108 km or 327,397 miles. Titan evolves farther at a mean distance of 1,221,870 km or 758 926 miles from Saturn. Titan is 5150 km or 3200 miles across whereas Rhea is only 1528 km or 949 miles across.
The view was obtained in visible green light with the Cassini probe narrow-angle camera on November 27, 2009. The shot was captured at a distance of about 1.2 million kilometers (746,000 miles) from the Opaque Moon and at a distance of approximately 2.3 million kilometers (1.4 million miles) from the icy moon Rhea.
The view unveils the anti-Saturn side of Titan and the trailing hemisphere of Rhea. A portion of Rhea's southern hemisphere can be identified through the haze of Titan's atmosphere. The detached haze layer of Titan's upper atmosphere can be observed, as well.
The view has been magnified by a factor of two and contrast-enhanced in order to increase visibility.Saturn's largest moon has been brightened by a factor of 1.5 relative to Rhea. Some large craters on Rhea can be clearly spotted in this view.
The viewing geometry with Titan and Rhea in the same image and in the same sequence allows scientists to improve their understanding of the orbits of the moons.

Image Credit: NASA/JPL/Space Science Institute


This near-infrared view shows the area of the bright Adiri on Saturn's largest moon, Titan. The camera scans the anti-Saturn side of the moon. The view, observed here, is centered on terrain at 2 degrees south latitude, 218 degrees west longitude. North is in the upper part of the image and inclined 6 degrees to the left.
The landscape portion was obtained with the ISS narrow-angle camera of the Cassini probe on January 29, 2010 using a spectral filter sensitive to wavelengths of near-infrared radiation centered at 938 nanometers. The image was taken at a distance of about 285,000 kilometers (177,000 miles) from the Orange Moon and at a Sun-Titan-spacecraft, or phase, angle of 45 degrees.
The Huygens probe landed close the to bright Adiri on January 14, 2005 in the Shangri-La region which is less reflective than Adiri. Shangri-La is a large, low-albedo area, located in the tropics, to the east of the bright Adiri. To the west of Adiri, one can identify the low-albedo region of Belet. Dune fields, such as Seif Dunes, are widespread in the tropics.

Image Credit: NASA/JPL/Space Science Institute


This near-infrared view of Titan's disk reveals the seasonal brightness dichotomy between the northern hemisphere and the southern hemisphere.
The view was obtained with the ISS narrow-angle camera of the Cassini probe on February 16, 2010 using a spectral filter sensitive to wavelengths of near-infrared radiation centered at 889 nanometers. The image was acquired at a distance of about 1.1 million kilometers or 684,000 miles from the Orange Moon and at a Sun-Titan-spacecraft, or phase, angle of 28 degrees.
The camera is orientated toward the trailing hemisphere of the Opaque Moon. North is in the upper part of the view and is inclined 12 degrees to the right.
The image clearly shows that the northern half of Titan's disk appears slightly lighter than the southern half. The brightness asymmetry is apparently closely related to the seasonal cycles of Saturn's largest moon. The northern hemisphere ended the winter season in August 2009 and is drawing closer to the summer season which will begin in the Summer Solstice of May 2017. By contrast, the southern hemisphere ended the summer season in August 2009 and is now approaching the winter season.
Complex processes related to seasons, involving the interactions between UV light from the Sun and the organic molecules of Titan's haze are expected to occur. The brightness dichotomy may be a consequence of the particular reactions in Titan's atmosphere.

Image Credit: NASA/JPL/Space Science Institute


This near-infrared view of Titan's disk unveils the dark region of Belet which can be found at 240 degrees west longitude in the equatorial area. The optically-dark Belet has a relatively low albedo compared to the widespread bright areas such as Adiri or Xanadu.The amount of light diffusely reflected in the Belet region appears relatively low.
Belet lies to the east of Senkyo and to the west of Adiri and Xanadu. The terrain seen in this portion of Titan's disk appears between the trailing hemisphere and anti-Saturn side of the Orange Moon. North is up and inclined 8 degrees to the left.
This global view was obtained with the ISS wide-angle camera of the Cassini probe on December 28, 2009 using a spectral filter sensitive to wavelengths of near-infrared radiation centered at 939 nanometers. The view was captured at a distance of about 282,000 kilometers (175,000 miles) from the Opaque Moon and at a Sun-Titan-spacecraft, or phase, angle of 45 degrees.
In mythology, Belet represents a Malay afterworld reached by a flower-lined bridge.

Image Credit: NASA/JPL/Space Science Institute


This mosaic of images acquired from the Cassini spacecraft unveils the enigmatic Hotei Regio, an optically bright area on Saturn's largest moon Titan. Hotei Regio appears to the east of the bright area of Xanadu and Hotei Arcus can be found at 28 degrees south latitude and 79 degrees west longitude.
The landscape portion in the upper part of the composite image was obtained with the Visual and Infrared Mapping Spectrometer (VIMS) aboard the Cassini probe. In the lower part of the mosaic, the same region is shown as a radar view thanks to the data of the Radar Mapper aboard the Cassini spacecraft.
The infrared or near-infrared view of Hotei Regio allows us to analyse its mineral and chemical make-up. The optically bright patch suggests that the region is made of a particularly reflective material. Is it made of water ice, frozen carbon dioxide, ammonia ice, or mixtures of hydrocarbons?
The radar view, appearing here in black and white clearly shows several large, bright, dendritic channels along the rims of the topographic bow. They are roughly perpendicular to the topographic boundaries. Those radar features may be related to ancient flows of slushy ice or cryolava. There may be active cryovolcanism in Hotei Regio according to scientists. The blue meandering lines in the VIMS image correspond to the radar-bright channels identified in the radar portion.
The topographic boundary may be dominated by hills and mountains from which the bright drainage channels took shape. Some dark channels or canyons can be observed inside the area which appears bright in the VIMS view: do they correspond to liquid pools of methane or ethane?
Some specialists argue that Hotei Arcus was probably generated from a meteoritic impact accounting for the topographic bow and the bright meandering channels. However, the assumption that the features result from cryovolcanism currently prevails and the idea that Hotei Regio could host a caldera is seriously considered.

Image Credit: NASA/JPL/USGS/UA


This mosaic of different types of images reveals the intriguing region "Hotei Regio" on Saturn's largest moon, Titan. Hotei Regio corresponds to the optically bright area where Hotei Arcus is found.
The color view in the upper part of the mosaic is a topographic map of the area generated on the basis of multiple images of the same portion. Significant variations in altitude appear in Hotei Regio.
The second landscape portion in the upper part of the mosaic was obtained with the Visual and Infrared Mapping Spectrometer (VIMS) of the Cassini spacecraft. It reveals a bright and relatively uniform area in Hotei Regio. Is the bright material a surface deposit resulting from lava flows or active cryovolcanoes spewing a slushy material, ammonia ice, water ice or carbon dioxide?
The third portion of Hotei Regio which appears in black and white is a radar view captured by the Radar Mapper of the Cassini probe. Several striking surface features can be observed. In the boundaries of the optically-bright patch, along the topographic bow, a series of perpendicular, bright, meandering channels can be clearly spotted. Are they related to ancient cryovolcanic flows or are they the outcome of a meteoritic impact?
In the left part of the radar swath, one can notice a very rough surface which may correspond to a mountainous or hilly region. Within the bright patch of Hotei Regio, one can observe very dark branching channels. Do they correspond to canyons or ethane and methane rivers?
The sketch in the lower part of the mosaic was generated on the basis of radar and infrared or near-infrared views of Hotei Regio. The violet patches may represent icy material resulting from cryovolcanism. The VIMS dark blue units may be particularly rich in water ice. The brownish parts may be dominated by hills or mountains.

Image Credit: NASA/JPL/USGS/UA


This view of the ISS narrow-angle camera of the Cassini spacecraft shows Saturn's largest moon Titan in the foreground, Mimas in the background and a portion of Saturn's rings. The image was captured shortly before the Orange Moon passed in front of and occulted the icy moon Mimas, as observed from the camera of the probe. That kind of relative movement of celestial bodies, in which one object passes close to or in front of another allows scientists to improve their understanding of the orbits of Saturn's moons.
The illuminated terrain observed on Titan lies between the trailing hemisphere and anti-Saturn side of the Hazy Moon. The sunlit side of Saturn's rings can be seen from just above the ringplane. Some portions of the rings are in the shadow of the Gas Giant. The illuminated terrain on Mimas appears on its Saturn-facing side.
Titan orbits Saturn at a mean distance of about 1,221,870 km or 760,000 miles while Mimas is moving at a mean distance of only 185,520 km or 115,500 miles from Saturn. Mimas is only about 396 kilometers or 246 miles in diameter whereas Titan appears as a giant moon with a diameter of about 5,150 kilometers or 3,200 miles.
The snapshot obtained in visible light was acquired on November 27, 2009 at a distance of about 1.1 million kilometers (684,000 miles) from the Orange Moon and 2.5 million kilometers (1.6 million miles) from Mimas. The disk of Titan clearly shows the detached blanket of gas which glides in the upper limit of the deep and opaque atmosphere.

Image Credit: NASA/JPL/Space Science Institute


This radar image of Titan's surface reveals, notably, topographic wrinkles or grooves as well as low mountains at mid-latitudes of the northern hemisphere.
This radar portion, measuring 250 kilometers (160 miles) vertically and 285 kilometers (180 miles) horizontally was acquired with the Synthetic Aperture Radar of the Radar Mapper from the Cassini probe on December 28, 2009. The area lies at 41 degrees north latitude and 213 degrees west longitude. The area is, roughly, at the same longitude as the bright Adiri and well above this region in an area appearing bright in the near-infrared spectrum. North is in the left part of the radar portion and the illumination comes from the top of the view, with an incident angle ranging from 11 to 25 degrees.
Bright topographic lines can be clearly identified in the lower left part of the view as well as in the upper part of the view. The direction of those topographic scratches is approximately similar in both regions, from west to east, a little southwards. Is it related to prevailing winds which draw the landscape with the bright material ? Or are there, for instance, tectonic forces or an internal activity such as currents from a subsurface ocean that are likely to generate linear fractures?
In the lower right part of the radar view, one can notice a multitude of dark grooves or wrinkles in a reflective area. The shape of this radar-bright area is irregular. The landscape in that topographic patch seems particularly complex: the general orientation of the most significant grooves seems to be from south to north or north to south, marking a shift with the orientation of the bright linear structures of the north part of the image.
There are several hypotheses to account for the formation of grooves or topographic wrinkles: the grooves can result from internal forces or tectonic forces which pull the crust of a planet or a moon apart generating cracks through which the molten material can infiltrate. The influence of tidal forces from Saturn and the other moons on the formation of this complex network of hills, mountains and grooves may be significant. Erosion can also play a key-role: wind and rainfall allow the formation of river channels that carve layers of rocks or ice.
The bright material seems to be relatively volatile compared to the radar-dark material which seems relatively stable and dense.

Image Credit: NASA/JPL


This near-infrared view of Titan's disk unveils, in particular, the "H" of the dark albedo features Fensal and Aztlan separated by the bright region Quivira which is situated near the center of the disk in the tropical latitudes of Saturn's largest moon. To the East of Aztlan, one can notice the region of Senkyo, a relatively low-albedo feature with a bright western border with two bright upper extensions with a shape reminiscent of the ears of a cony. At about the same longitude as Senkyo, above Senkyo and at about the same latitude as Fensal below 30 degrees north latitude, one can spot Aaru. The optically-dark regions, mostly located in the low latitudes of Titan tend to be dominated by dune fields similar to Seif dunes on our planet.
This portion of the globe of Titan is facing Saturn. North appears in the upper part of the disk and is tilted 24 degrees to the right. The image was obtained with the ISS narrow-angle camera of the Cassini probe on June 25, 2009 incorporating a spectral filter sensitive to wavelengths of near-infrared light centered at 938 nanometers. The view was acquired at a distance of approximately 1.3 million kilometers (808,000 miles) from the Orange Moon and at a Sun-Titan-spacecraft, or phase, angle of 12 degrees.

Image Credit: NASA/JPL/Space Science Institute


This natural color view reveals Titan and Tethys, with Titan partly eclipsing Tethys which is moving farther from the Cassini spacecraft in that particular configuration.
Saturn's largest moon Titan moves at a mean distance of about 1,221,870 km (760,000 miles) from Saturn while Tethys is closer to the ringed planet, evolving at a mean distance of about 294,619 km (183,000 miles) from Saturn. In this sequence, Tethys (1062 kilometers across or 660 miles across) is actually more than twice as far from the Cassini probe than Titan (5,150 kilometers or 3,200 miles across): Tethys appears 2.2 million kilometers (1.4 million miles) from the Cassini spacecraft and Titan is approximately 1 million kilometers (621,000 miles) away.
The views of the moons were acquired about 15 minutes apart, with the image on the right occuring first. That kind of sequence in which one moon passes in front of another moon allows scientists to refine their understanding of the orbits of Saturn's satellites.
In the left view, one can clearly observe the "Odysseus" crater of the bright moon Tethys, located in its leading hemisphere. Odysseus appears to be the largest crater on Tethys with a mean diameter of 445 km (277 miles). The deep and thick atmosphere of Titan is, as usual, completely opaque in the spectrum of visible light. One can observe, notably, the blue haze in the upper limits of the gas blanket of the Orange Moon.
Views captured using red, green and blue spectral filters were combined to generate this natural color view. The images were acquired with the Cassini probe narrow-angle camera on November 26, 2009.

Image Source: NASA/JPL/Space Science Institute


This near-infrared view of Titan's disk reveals the seasonal hemispheric dichotomy of Saturn's largest moon, the northern half appearing, at this time, slightly brighter than the southern half.
The portion of Titan's globe observed here corresponds to the Saturn-facing side of the Orange Moon and north is up. The image was obtained with the ISS narrow-angle camera of the Cassini probe on October 16, 2009 incorporating a spectral filter sensitive to wavelengths of near-infrared radiation centered at 889 nanometers. The image was acquired at a distance of about 2.6 million kilometers or 1.6 million miles from the opaque moon and at a Sun-Titan-spacecraft, or phase, angle of 71 degrees.
The northern hemisphere of Titan is currently in the spring season whereas the southern hemisphere is in the autumn season. The winter season in the northern hemisphere and the summer season in the southern hemisphere came to an end in August 2009 and each season lasts approximately 7 Earth years.

Image Source: NASA/JPL/Space Science Institute


Titan Images 2009
Titan Images 2008
Titan Images 2007
Titan Images 2006
Titan Images 2005, 2004

Back to main page