Titan Images 2006


Cassini Huygens Mission Images

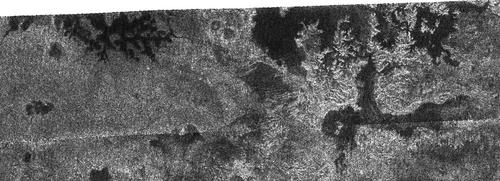
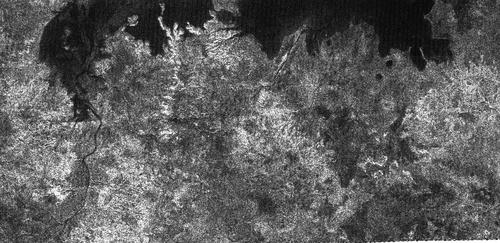
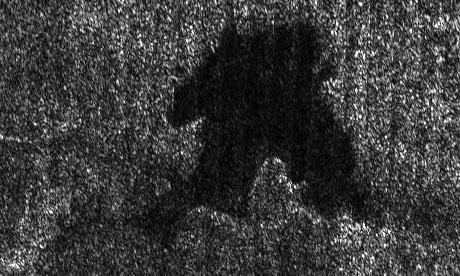
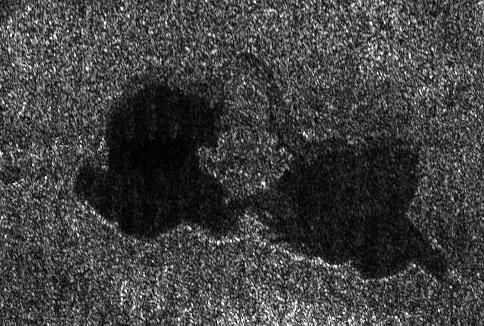
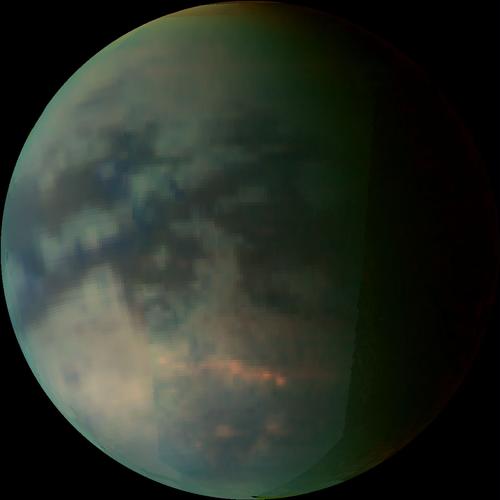
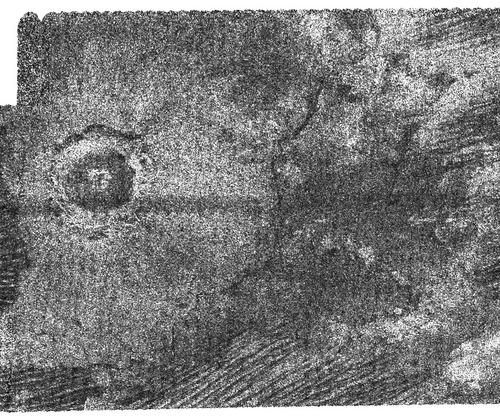
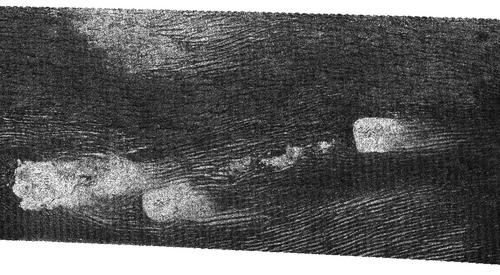
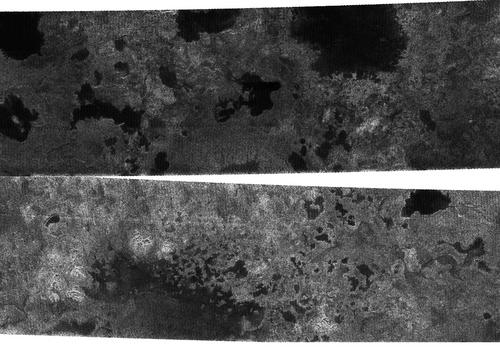
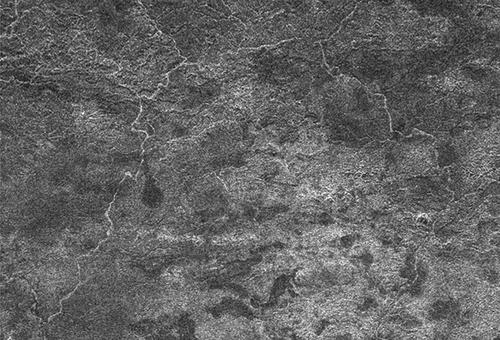
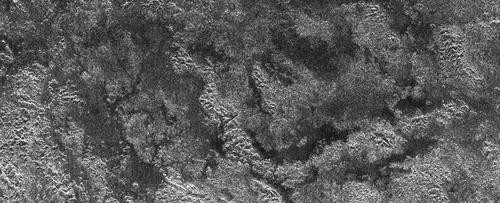
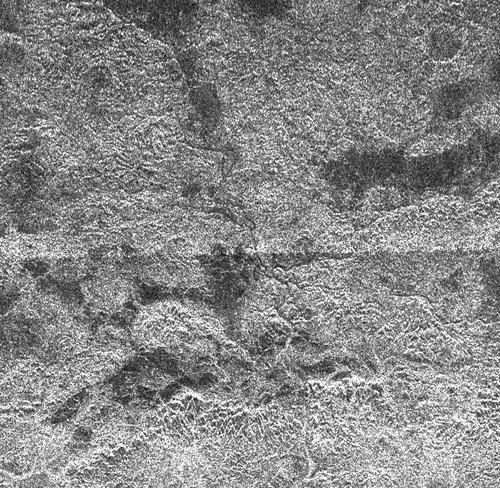
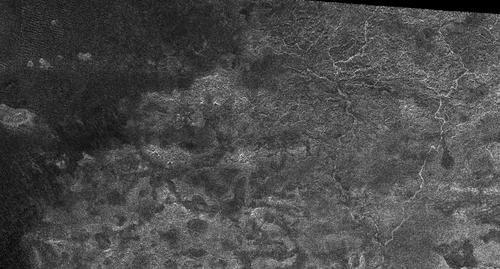
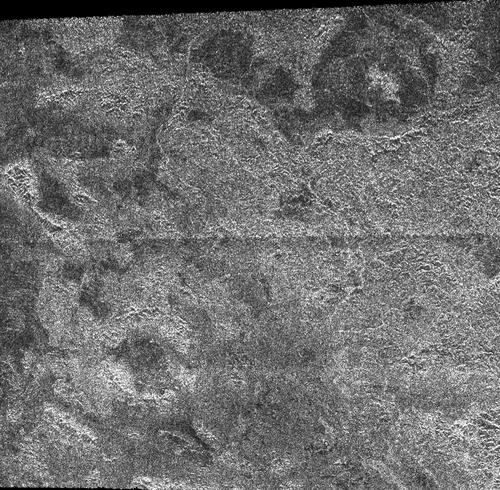
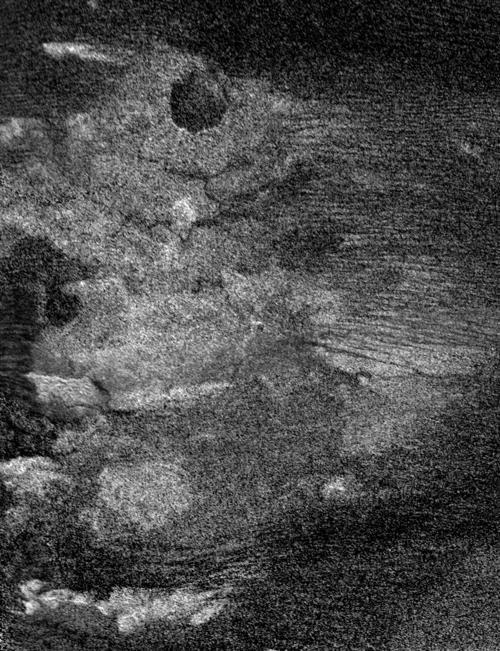
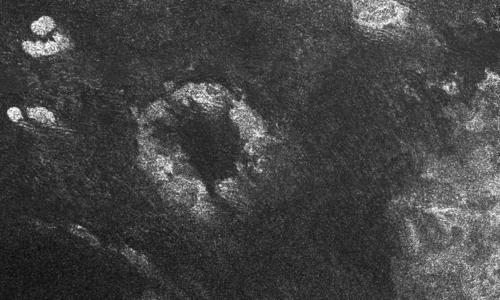
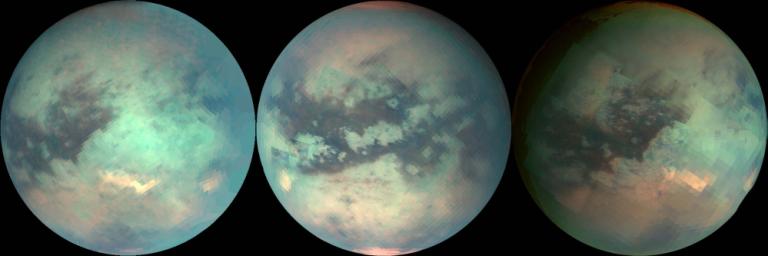
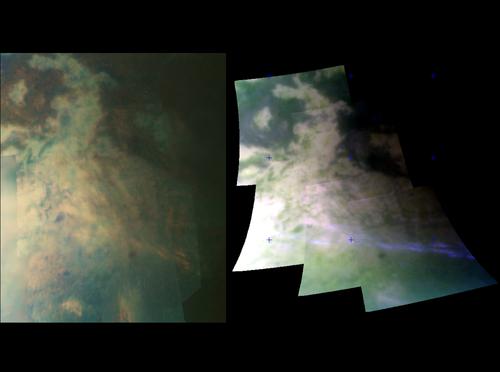
These infrared images were captured during the October 25 flyby designed to obtain the highest-resolution infrared views of Titan yet. They were taken at a distance of 15,000 kilometers ( 9,300 miles ) from Titan. The area is riddled by mountain ranges and reveals a cirrus-like cloud formation. A massive mountain range located just south of Titan's equator runs from southeast to northwest. It is about 150 kilometers long ( 93 miles ), 30 kilometers ( 19 miles ) wide and about 1.5 kilometers ( nearly a mile ) high. It probably results from material welling up below as the crust of Titan is pulled apart by tectonic forces. A circular feature, perhaps an impact basin can be spotted top left of the area. The meteoritic impact might have triggered tectonic events and distortions of the ice crust. Is the cloud linked to a volcanic activity ? not sure! The clouds might be produced when gaseous methane in Titan's atmosphere cools and condenses into methane fog as Titan's winds drive air over the mountains.

Image source: NASA, JPL


This radar image was taken by the radar mapper onboard the Cassini probe during the Titan flyby of October 9, 2006. It is centered near 80 degrees north latitude, 357 degrees west longitude and it measures about 310 kilometers by 100 kilometers ( 190 miles by 62 miles ). The dark patch on the upper left of the image presents a remarkable shape with branching channels. It is reminiscent both in form and scale of the flooded drainage system, Lake Powell in Utah and Arizona. The right part of the image seems to reveal irregular landscape features with mountains, hills, steep slopes and cliffs. The coastline appears to be clearly eroded and the bright landforms seem relatively fragile and unstable. Many islands or peninsulas can be spotted in this region.

Image source: NASA, JPL


This radar image was captured during the Titan flyby of October 9, 2006 by the Cassini radar instrument in synthetic aperture mode. The image is centered near 73 degrees north latitude , 343 degrees west longitude, and measures about 300 kilometers by 140 kilometers ( 190 miles by 90 miles ). The high latitudes surrounding Titan's north pole reveal a pleiade of what appear to be lakes or seas. This radar image brings new clues in favour of the lake hypothesis: several dark channels connected to the dark patches, likely drainage channels, can be clearly identified. The dark channel on the left part of the image meanders over almost 100 kilometers ( 62 miles ) from a relatively dark patch. Another dark channel in the center of the image can also be seen: it is relatively straight which suggests possible faulting in the subsurface. Clear contrasts between dark patches and bright patches may indicate cliffs or steep shorelines. The bright landforms jutting into the lake reveal that old, eroded landforms may have flooded. The origin of the pools is still unclear: rains, cryovolcanoes, hot springs or subsurface ocean ?

Image source: NASA, JPL


This radar image was acquired by the Cassini radar instrument during the Titan flyby of September 23, 2006. It is centered near 74 degrees north, 65 degrees west longitude. The assumed lake , likely composed of methane or ethane, is roughly 20 kilometers by 25 kilometers ( 12 to 16 miles ) across. Clear shorelines appear with relatively narrow bays, largely smaller, for instance, than the "Baie des Anges" ( French Riviera ) or the "Hudson Bay" ( Canada ). A broad peninsula, marking a significant contrast with the dark area appears in the south part of the lake: it probably reveals a steep or eroded shoreline: a cliff for example. The bay in the south east of the lake has relatively blurred boundaries in its eastern coast: the terrain is likely gentler , as on a beach.

Image source: NASA, JPL


This Cassini Radar image was captured during the flyby of September 23, 2006. It is located near 73 degrees north latitude, 46 degrees west longitude. The image covers an area about 60 kilometers ( 37 mles ) wide by 40 kilometers ( 25 miles ) high. Two interconnected lakes can be clearly identified, each 20 to 25 kilometers ( 12 to 16 miles ) across. Those "kissing lakes" are joined by a relatively narrow channel. The southern rims of the lakes show a clear contrast with the lakes. The crust seems to be dug by the assumed methane or ethane liquid. It's a lake-like characteristic. On the other hand, the northern boundaries are more progressive which means that the depth of the lakes is probably lower. The lake on the right has lighter patches within it, suggesting that it may be slowly drying out as the northern summer approaches.

Image source: NASA, JPL


This infrared image of Titan was taken by the VIMS ( Visual Infrared Mapping Spectrometer ) onboard the Cassini spacecraft during the flyby of July 22, 2006. It was generated using the 5 micron wavelength for red, the 2 micron wavelength for green and the 1.2 micron wavelength for blue. It was captured at 160,000 kilometers ( 99,000 miles) from Titan. The reddish patch spreading out along the 40-degree-south latitude line corresponds to clouds ( lower part of the moon ).

Image source: NASA, JPL


This radar image was taken by the Cassini radar instrument in synthetic aperture mode during the Titan flyby of September 7, 2006. The image is centered at 70 degrees west longitude, 10 degrees north latitude, and measures about 150 kilometers high by 190 kilometers wide ( 93 by 118 miles). An impact crater, around 30 kilometers ( 19 miles ) wide is clearly visible on the image. Its shape gives scientists insight into the structure of the crust beneath Titan's surface. The crater reveals a reflective central peak which gives some indications about the conditions of impact, thickness of the crust or properties of the meteorite that made the crater. The dark floor around the central peak indicates smooth or highly absorbing materials.Some craters, such as Sinlap, don't have any central peak. So far, Cassini data have only unveiled three definite impact craters on Titan. Furthermore, a multitude of parallel streaks, likely dunes and very commun around the equator can be identified. No doubt that they result from the action of west to east winds.

Image source: NASA, JPL


This radar image was obtained by the Cassini radar instrument in synthetic aperture mode during the Titan flyby of September 7, 2006. The image is centered at 44 degrees west longitude, 8 degrees north latitude.It measures about 160 kilometers high by 325 kilometers wide ( 99 by 202 miles ). The dark ridges, streaks or "cat scratches" are interpreted to be longitudinal dunes. They likely result from the action of wind. They are very common along the equator. They are spaced up to 3 kilometers ( about 2 miles ) apart. They curve around bright features that may be high-standing topographic obstacles. Titan dunes may be composed of solid organic particles or ice coated with organic material.

The bright, reflective patches might consist of frozen carbon dioxide, water ice, or ammonia ice.

Image source: NASA, JPL


These two radar images were captured on July 21, 2006 by the Cassini radar instrument in synthetic aperture mode. The top image centered near 80 degrees north, 92 degrees west measures about 420 kilometers by 150 kilometers ( 260 miles by 93 miles ). The lower image centered near 78 degrees north, 18 degrees west measures about 475 kilometers by 150 kilometers ( 295 miles by 93 miles ). Smallest details in this image are about 500 meters ( 1,640 feet ) across. The striking characteristic of these two radar images is the presence of several dark patches, indicating an extremely smooth or absorbing surface. That implies that they are probably lakes or seas. It contrasts with the Xanadu region which appears very bright. The dark areas have an irregular shape and clear boundaries or rims. And some dark features are connected to dark channels, likely drainage channels. It's very unlikely that they result from impact craters as they have diversified shapes. The radar images were taken at high latitudes around the north pole where it is currently winter. The amount of sunlight reaching the surface is very limited. As a result, the temperature is a little weaker than that of lower latitudes and the evaporation and convection processes are lowered. Titan lakes likely consist of methane or ethane.

Image source: NASA, JPL


This radar image was acquired by the Cassini Radar Mapper on April 30, 2006. This portion is roughly 230 kilometers ( 143 miles ) wide and 340 kilometers ( 211 miles ) long. It reveals features as small as 500 meters ( 1,640 feet ). Xanadu is carved by a multitude of channels meandering through a diversified landscape with many mountains or hills,valleys and plains. The clearly visible river channel, above, starts from the top of the image and splits to the right and left of the image. Those linear structures are likely streams of methane or ethane. They appear bright on the radar image which means that they are composed of a rough or scattering material. Dark regions indicate a more absorbing material, possibly liquid. The roughly circular, dark feature on the left part of the image is intriguing. Does it indicate a pool of methane? Is it the outcome of an impact crater?

Image source: NASA, JPL


More than one year after the Huygens probe landed on the surface of Saturn's moon Titan, the ESA has just released the colour images taken by the spacecraft during its parachuted descent in the thick atmosphere of Titan. Below an altitude of 60 km, the haze is sufficiently weak to allow a good vision of the Titan landscape. This view is a stereographic ( fish-eye ) projection taken with the descent imager/ spectral radiometer ( DISR ) when the probe was around 5 kilometers ( 3 miles ) above Titan's surface. A striking feature in this landscape is the contrast between a dark, reddish apparently flat surface and a bright white area, made of hills or elevated terrain with channels or fractures at its edges. The question still remains regarding the nature and the origin of these dark channels ( fractures, springs, cryovolcanism, rivers or gullies ).It is tempting to claim that these bright patches are water ice bedrocks. Some planetologists speculate that the bright areas of Titan might be an ice layer, perhaps similar to the surface of Enceladus. The dark areas are probably composed of wet sand.

Image source: ESA


This radar image was captured by the Titan Radar Mapper instrument onboard the Cassini spacecraft during the flyby of April 30, 2006.The covered area lies atop Xanadu, the bright area of Titan. The image is roughly 150 kilometers ( 93 miles ) wide by 400 kilometers ( 249 miles ) long, and shows features as small as 350 meters ( 1148 feet ). Stretched bright patches represent chains of hills or mountains. The dark areas between the chains of mountains show no topographic features. Some areas are very dark and appear relatively uniform which suggests they might be filled with wet sand or even liquid methane or liquid ethane. Fractures, rivers or gullies can be identified in the chains of mountains. Larger faint branching networks take shape in the left part of the image.

Image source: NASA, JPL


This radar image was acquired by the radar mapper onboard the Cassini orbiter during the Titan flyby of April 30, 2006. The area is located atop Xanadu. Details as small as 350 meters ( 1148 feet ) can be identified. Each side of the picture covers 200 kilometers ( 124 miles ).The region is apparently dominated by a very complex landscape. Chains of hills or mountains are drawn near the bottom of the image, appearing bright on their north side ( toward the top in this image ). Dark drainage channels covering more than 100 km ( 62.5 miles ) are clearly visible from the middle of the image to the right of the image. Xanadu is thought to be covered with water-ice bedrock. Some drainage channels appear to empty into the dark region near the top of the image. Liquid methane might be fed from springs within Xanadu or by occasional rainfall suspected to occur on Titan.

Image source: NASA, JPL


This radar image taken during the Titan flyby of April 30, 2006 by the Synthetic Aperture Radar instrument on the Cassini spacecraft reveals the western margin of Xanadu. Bright narrow and sinuous channels are clearly visible on the right-hand-side of the image. These may be rivers networks that might have flowed onto the dark areas on the left of the image. Top right of the image, one can observe linear and parallel dark streaks, likely sand dunes.

Image source: NASA, JPL


The radar image above, taken on April 30, 2006 by the Synthetic Aperture Radar instrument on the Cassini spacecraft unveils two circular features in the radar-bright region Xanadu. The dark circular feature on the top right of the image is a 70-kilometer-wide ( 47-mile-wide ) impact structure. It has a particularity compared to other impact craters: it shows a prominent bright central peak, indicating that the interaction between the impact and the crust was different in this region. By contrast, the dark circular feature at the bottom left of the image has no bright central peak. A network of drainage channels appears in this radar image like in many other places on Titan.

Image source: NASA, JPL


The radar image, above, captured on April 30, 2006, unveils "Shikoku Facula" nicknamed "Great Britain", a bright part of the "Shangri-La" region, in the hemisphere opposite to Saturn. This Titan image covers around 300 km from left to right ( 187 miles ) and about 400 km in the vertical direction ( 250 miles ). A dark circular feature, 35 km in diameter ( 22 miles ) is clearly visible at the top of the image. It's likely an impact crater but the hypothesis of a caldera can't be ruled out. Two connected dark channels at least 80 km long appear in the bright area below the circular feature. And once again, the Synthetic Aperture Radar instrument has identified a multitude of dark parallel linear streaks, probably sand dunes, from left to right. No doubt that the wind plays a key role in forming Titan topography.

Image source: NASA, JPL


This radar image, acquired on April 30, 2006 reveals the southwestern area of a feature called Xanadu ( bottom right of the image ). The image is about 400 km large and 250 km upward. The dark area is part of the Shangri-La region. In the middle of the image, the circular feature whose name is Guabonito likely represents an impact crater. Some scientists advance it might also be a cryovolcanic caldera. It is about 90 kilometers ( 56 miles ) in diameter. If this is an impact crater, the absence of an ejecta blanket suggests that the feature has been highly eroded, like some impact structures on Earth, or has been buried by the dune fields. Other radar- bright areas ( top left and top right ) appear to be topographically high and might divert the dunes around them. The image also shows numerous curvy features that may indicate fluid flows. And a multitude of parallel dark streaks, probably sand dunes,can be identified.

Image source: NASA, JPL


The three Titan mosaics above correspond to infrared views taken by the Cassini's Visual and Infrared Mapping Spectrometer ( VIMS) at different periods ( the three previous flybys). These false-color images were assembled from images taken at the following wavelengths: 1.6 microns ( blue ), 2.01 ( green ), and 5 microns ( red ). The left image is related to the flyby of October 28, 2005. The middle image was obtained during the flyby of December 26, 2005 and the right image was acquired during the latest flyby of January 15, 2006. The first and the third mosaic show the same region of Titan while the image of the December flyby ( middle image ) reveals roughly the opposite hemisphere of Titan. One can note a striking feature by comparing these three images: during the December flyby ( middle image ), the poles appear very bright. In the south pole, it is linked to cloud formations. But, the cloud system is barely visible during the October and January flybys which implies that the meteorology is very dynamic in the south pole. The north polar hood, very reflective at 5 microns is clearly visible in the December flyby. Its origin is still unknown. In the two other flybys, this bright patch is barely seen. On the October and December flybys, two bright patches at mid latitudes can be identified. The biggest patch, just south of the equator is Tui Reggio, a region nicknamed the "chevron". This area is very bright at 5 microns and is among the brightest features on Titan at that wavelength. It is thought to be a surface deposit, probably of volcanic origin, and may be water and / or carbon dioxide frozen from the vapor. The December flyby data indicate that the western margins of Tui Reggio have a complex flow-like character probably due to eruptive phenomena.

Image source: NASA, JPL, University of Arizona


This infrared map of Titan was constructed on the basis of data taken by Cassini's visual and infrared mapping spectrometer during the last two Titan flybys, on December 26, 2005 and January 15, 2006. The map was generated from false-color images taken at wavelengths of 1.6 microns shown in blue, 2.01 microns in green, and 5 microns in red. The image captured during the December flyby represents roughly the opposite hemisphere of the flyby in January. It turns out that the darker areas are concentrated in the equatorial regions. Two very bright regions can be identified: the large one known as Tui Reggio is located at approximately 25 degrees south latitude and 130 degrees west longitude. The other one, called Hotei Arcus is located at 20 degrees south latitude and 80 degrees west longitude. Those bright patches might be related to volcanic eruptions and surface deposits. If it is really linked to cryovolcanism, the deposits probably consist of water ice and / or frozen carbon dioxide. The western margins of Tui Reggio have a complex flow-like structure which strengthens the hypothesis of eruptive phenomena. The reddish patch at the south pole is Titan's south polar cloud system. It was very bright during the December flyby. But the flyby of January shows that the large cloud formations have dissipated. Hence, it seems that the south polar meteorology is very dynamic. The impact crater Sinlap is clearly visible at approximately latitude 13 degrees north and longitude 16 degrees west. The poorly resolved regions between longitudes of 30 degrees and 150 degrees east will be filled in during subsequent flybys.

Image source: NASA, JPL, University of Arizona


To have access to Titan images of 2005 and 2004, click on the link below:

Titan images 2005 and 2004

Main Page